
Return on investment (ROI) measures the profit earned from marketing investments (or costs). ROI is measured as a percentage of profit, and it can be positive or negative.
Other marketing ROI calculators online may provide the basic formula, but if you’re looking for an easy way to accurately measure your return for different marketing campaigns such as the marketing ROI of:
…or any other marketing investment, you need to factor in all of the unique campaign costs and investments that go into different campaign types.
We made it easy for you. You can use our digital marketing ROI calculator as a template to calculate the ROI of each campaign type you are currently running.

Below, we’ll show you how to use the spreadsheet calculator and explain the metrics that factor into calculating the ROI of different marketing channels. You can use this as a handy reference to avoid wasting time when you need to report on your campaigns.
You can use our marketing ROI calculator spreadsheet to discover the ROI of your marketing campaigns. Sign up to see how our full reporting platform for marketing agencies can help you automatically find insights to increase ROI.
Marketing ROI Formula
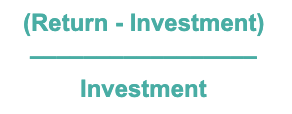
The basic Marketing ROI formula is:
This is what it looks like in our marketing ROI calculator tool:
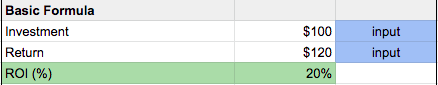
“Input” next to a cell indicates where you will enter your information; the calculator will then automatically calculate your ROI once you’ve entered your numbers.
This basic ROI equation is just too simple. The real digital marketing version of an ROI calculator adds up the collection of investments that generate traffic and the returns from that traffic along the entire path to revenue.
With traffic as a starting point, the formula to get your marketing return realistically will look more like:
- Traffic
- % Conversion 1
- % Conversion 2
- Total Sales
- Value of Sales

For example, if you’re doing a combination of campaign types, you’ll calculate the value of the sale, subtract your investments, and divide by your investments to get the ROI %:
![ROI: [(Traffic > % Conversion 1 > % Conversion 2 > Total Sales > Value of Sale) x (Each Marketing Campaign)] - (Marketing Investments) divided by Marketing Investments](https://cdn.prod.website-files.com/63dc4e9656c3fb684c8aef25/6458ce7bc51db9032066c2cc_ROI-.png)
This might look complex, but in reality, the complexity depends on how many investments and returns your business has among all of its marketing campaigns.
If you can attribute conversions and revenue to the traffic that lands on your site from any marketing campaign, you can figure out the marketing ROI from it by adding up your investments.
To calculate your returns, you’ll want to consider the following:
- If you’re measuring ROI of content and SEO:
- How much traffic are you getting?
- What is the conversion rate?
- If you’re measuring the ROI of email:
- How much traffic from email are you getting?
- What is the conversion rate of it?
- If you’re running PPC ads:
- What is your cost per click (CPC)?
- What are the conversion rates from click to conversion?
Important note: Without proper attribution set up, you won’t be able to get the metrics that allow you to calculate ROI at this level. If you have not connected your marketing channels to software like Google Analytics that tracks the traffic from them, make sure you have that set up before making ROI calculations.
We’ve outlined how to use this formula across different campaign types for 1 and 2 conversion rates, which is typical for most businesses. Let’s go into how to measure these campaign types.
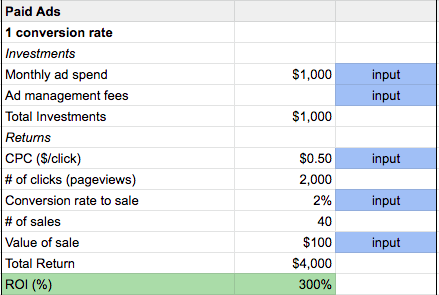
How to Measure Paid Media ROI (ROAS)
When it comes to the investments that go into Paid Ads and other forms of paid media, your investment inputs will typically be:
- Monthly ad spend
- Ad management fees
Your returns will be the results of your paid ads, typically:
- CPC
- Number of clicks (pageviews)
- Conversation rate to sale
- Number of sales
- Value of sale
- Total return (Total revenue)
Note: The input “Value of Sale” varies. For subscription companies, it might be an annual value number like Customer Lifetime Value (CLV). Or for eCommerce companies, it will typically be an Average Order Value (AOV).
Our Paid Ads Calculator in Google Docs
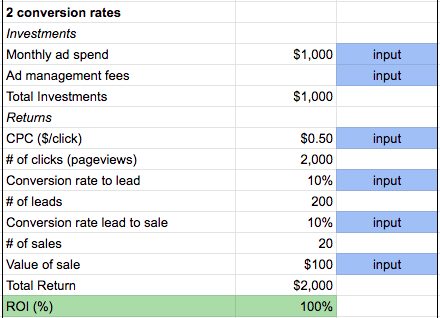
Paid Ads with 2 Conversion Rates
Many ads have multiple conversions before a sale happens, such as a signup “lead” that then must convert again into a sale. In that case, you can copy an input row and add an additional conversion rate below the first:
To be rigorous, you may want to allocate an additional cost to take into account how much you’re paying an employee (or employees) to run these operations. To calculate this, you need to determine the percent of an employee’s time that is being spent on this, and then multiply that percentage by their salary.
Note: When you’re using this sheet, you can add a row for “Other costs” such as “employee salary” (or the title of the cost) to factor in any additional campaign investments. For example:
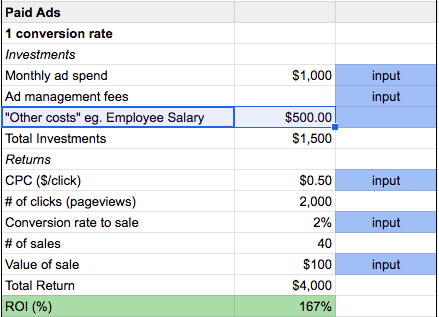
Again, blue is what you input. Clear cells (not labeled) are what the calculator does on its own.
How to Calculate the ROI of Content Marketing and SEO
Marketers are often puzzled at how to calculate ROI for content marketing and SEO, even if they’ve been doing both for a while.
It seems hard because content marketing campaigns can often stretch over long periods of time, but that doesn’t mean you can’t see what the ROI of it is right now.
When you calculate the ROI of content, the same principle of adding up your investments and picking the right returns to focus on applies.
Investments in content marketing and SEO work usually include:
- The creation of the content (typically articles)
- The promotion of the content
It’s up to you to break down what the different costs in creating and promoting the content are (such as the price per article, or the amount of money for advertising and doing link building to the content).
Returns from inbound marketing metrics typically reported on are:
- Monthly traffic
- Conversion rates from traffic to a lead
- Number of leads
- Conversion rates of leads to a sale
- Number of sales
- Value of sale
- Total return

As you can see, just like when we calculated the ROI of paid ads above, the returns follow each step on the path to a sale.
Then you subtract the investments and divide that total by the investments to get your overall ROI of content marketing and SEO.
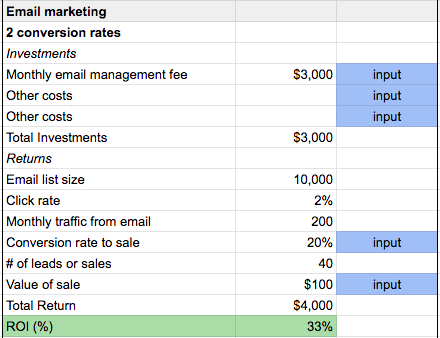
How to Calculate the ROI of Email Marketing
Is your business using email to nurture leads into sales and re-engage past customers?
Once attribution is set up properly in your CRM or email platform, it’s easy to see the sales that came in from an individual email marketing campaign that you send.
However, email marketing ROI overall can sometimes be a black box. But with an understanding of which metrics to include, and the right tool to make the calculation, it doesn’t have to be.
Let’s walk through how to calculate ROI from the investments and returns of building an email list.
Investments in email marketing may account for:
- Monthly email management fee
- The cost to produce your email content
- Any salary for an in-house email manager or newsletter creator
To calculate returns, start with your email list size, and then look at:
- Click rate
- Monthly traffic from email
- Conversion rate to sale
- Number of leads or sales
- Value of sale
- Total return
Add up the investments, subtract them from the returns, and then divide again by the investments to get your ROI from email.
Click to go to the Marketing ROI Calculator
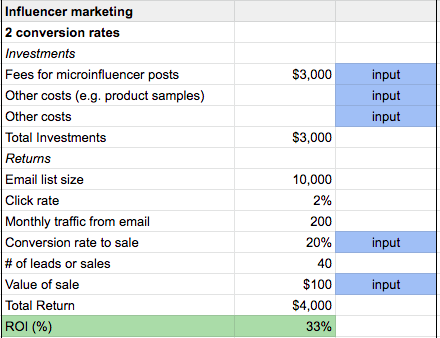
How to Calculate the ROI of Influencer Marketing
Influencer marketing is becoming a standard campaign type that eCommerce brands are best known for using (and B2B brands have adopted as well). There are multiple touchpoints between asking an influencer for a post and getting a sale from their platform.
To keep it simple, focus on what matters. The investments for influencer marketing include:
- Cost in labor or resources to find and reach out to influencers
- The fees for the posts
- Product samples or other incentives
- Cost of associated creative work for the campaign such as creating posts for the influencer or creating a giveaway
Then, subtract those investments from the total return.
Note: Campaigns with different conversion goals will use different inputs to calculate your investments. For example, if you’re directing people from the influencer’s platform to your email list, you’ll use a different input than you would if you’re directing them to a landing page.
In both cases, you’ll be measuring the potential traffic that can be generated by the influencer as the starting point, such as their email list, social media follower count, or a similar number. Then you’ll continue calculating the other return metrics of that traffic.
For example, to calculate the ROI of getting featured in an influencer’s email list, you would input:
- Lead conversion rates from the influencer’s campaign
- Sales conversions from the leads
The returns from email marketing in this case would be:
- Potential number of traffic (email list size)
- Click rate
- Recurring monthly traffic
- Conversion rate to sale
- Number of leads or sales
- Value of sale
- Total return
We know it can be overwhelming to track the success of multiple marketing campaigns. Running a marketing strategy for multiple clients requires a lot of time being put into tracking and reporting for each account.
Hopefully this marketing ROI calculator tool makes it easier for you to track the success of your campaigns. Feel free to make a copy for yourself!
We built ReportGarden’s platform to make reporting easy and painless so that you can focus on doing the work of actual marketing activities for your accounts. Sign up today to see how painless tracking and reporting can be.
.png)


