LinkedIn is a social media platform which is built specifically for professionals and brands to connect. This social media platform might guide you to believe that its usage is only for B2B companies. But this is not the truth.
LinkedIn is overlooked by some businesses for their own marketing efforts. LinkedIn has many well-defined advantages over the most popular social media platforms like Twitter and Facebook.
For B2B businesses, LinkedIn is clearly very powerful. It provides a great way to prospect and network. Also for B2C companies, LinkedIn has a lot of benefits.
For now, LinkedIn only offers insights for Company Pages.
What Are LinkedIn Analytics?
LinkedIn Analytics is a built-in tool that measures your business’s LinkedIn performance. This helps understand how your activities on the platform are doing with regard to growth – featuring KPIs like engagement metrics, audience information, leads and visitors, and more.
At present, detailed analytics are only available for company pages. While analytics are available for personal pages as well, you’ll find they don’t offer as much insight as company page analytics.
Why Use LinkedIn Analytics?
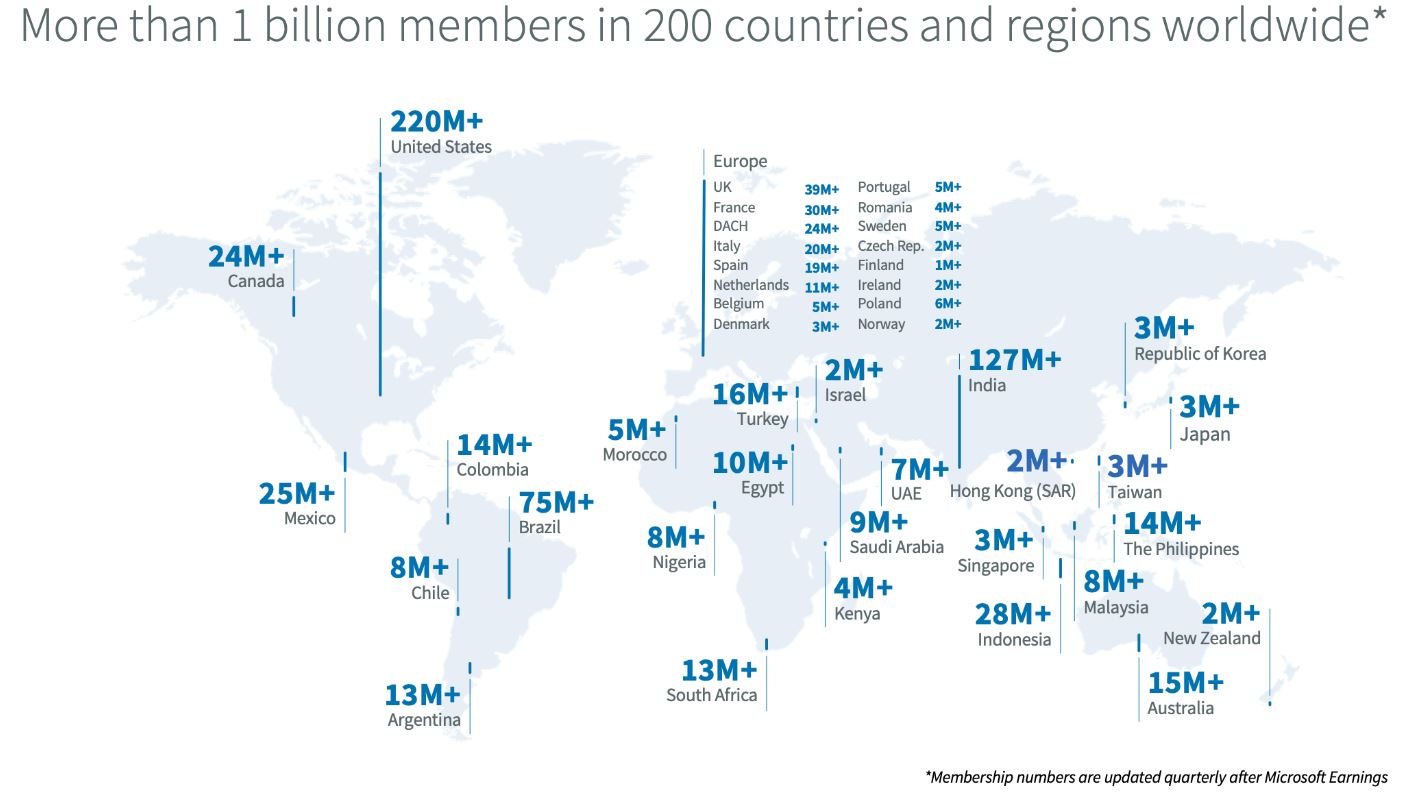
Microsoft reports record levels of engagement on LinkedIn annually, with 1 billion members registered (source). It offers a fantastic network to tap into and enhance your company’s growth.
- Easily Track ROI
The aggregate data about your organic and sponsored performance metrics help you justify and measure your ROI. - Detailed Performance Analysis
LinkedIn Analytics helps you understand the efficacy of your content, offering valuable insights that can perfect your online strategy, such as engagement and campaign data. - Competitor Analysis
You can track how your posts fare against your competitors’, highlighting a gap that can be filled to improve your online presence. - Recruiting Efforts
To build a reputation and to attract prospective employees, analytics is considered as a great way for a strong company profile.
Key LinkedIn Metrics To Track
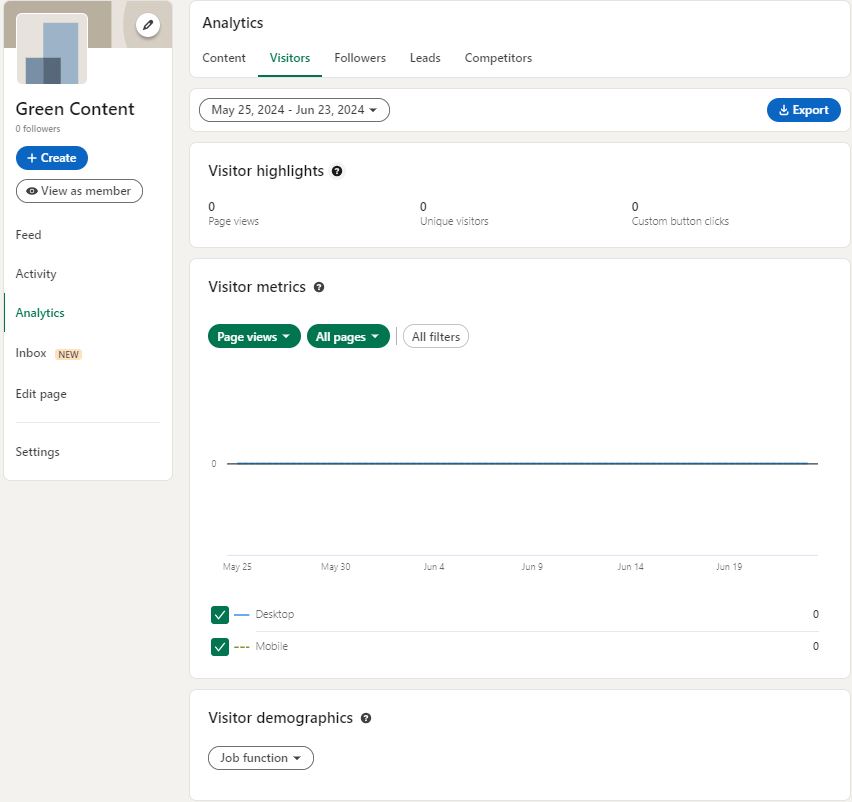
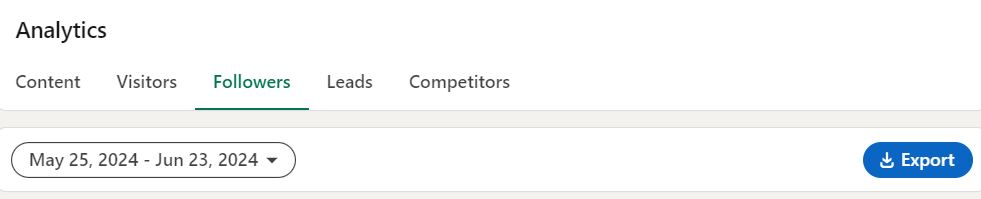
The LinkedIn Analytics tab offers data on Content, Visitors, Followers, Leads, Competitors, and Employee Advocacy.
We’ll classify the most important LinkedIn metrics based on type to make things easier.
Types of LinkedIn Metrics
Engagement
- Post Impressions: The amount of times a post appears in a user’s feed.
- Unique Views: The number of accounts your post was shown to.
- Clicks: The number of times a LinkedIn user clicked on your post, logo, or company name. Multiple clicks from the same account count as one click. This excludes reactions, comments, and reposts.
- Interactions: The amount of interactions on your post including reactions (‘Like’, ‘Celebrate’, ‘Support’, ‘Love’, ‘Insightful’, ‘Funny’), comments, and reposts.
- Engagement Rate: The rate at which users interact with your post.
Calculation: (Clicks + Reactions + Comments + Shares + Follows)Impressions
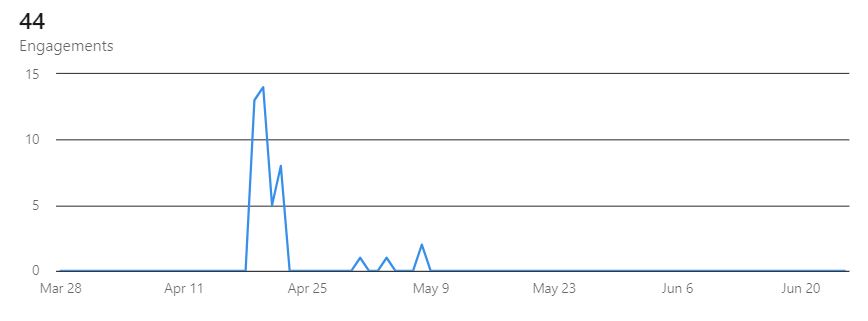
Engagement metrics show how your content performs and appeals to readers.
If your engagement is low:
- Optimize content quality and post-scheduling factors like timing and post type. Posts offering value or expertise are more likely to be shared.
- Include images to add visual appeal to your posts to attract more readers.
Followers and Visitors
- Page views: The amount of times your page was viewed by users.
- Unique Visitors: The number of unique users who visited your page (excludes multiple visits from the same account). This includes data from desktop and mobile sessions.
- Followers: The number of people who ‘followed’ your page. Follower metrics show organic and sponsored followers both.
Organic followers are those gained without paid campaigns, while sponsored ones are achieved through paid advertisement.
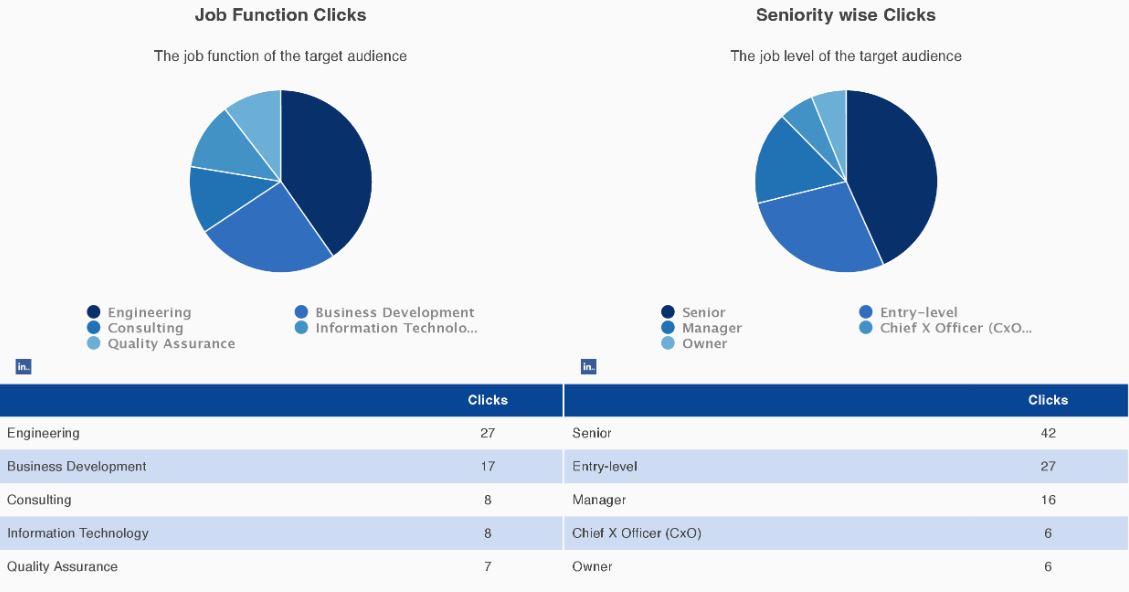
- Follower and Visitor Demographics: The Job Function, Industry, Company Size, Location, and Seniority of visitors and followers.
Combined, these metrics enhance your audience understanding and help make targeted content. If you aren’t getting enough organic followers and views, you may need to better understand your intended audience.
- Analyze and assess your current versus ideal audiences using demographic data, then tailor your content accordingly.
- Use the right hashtags and encourage employees or your network to share your content for increased reach.
Lead Analytics
- Total Leads: The total number of leads generated by your lead form.
- New Leads: The number of new leads who filled your lead form.
- Signups: The number of people who registered for your platform’s campaign.
- Lead integration with marketing automations/CRM systems: Integrate leads with CRM systems for streamlined data management.
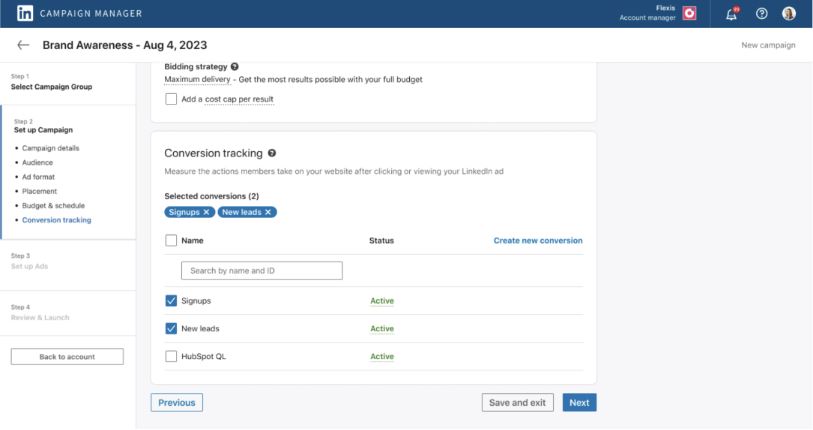
Lead analytics will be visible only if your page includes a lead form and in the campaign manager dashboard if you have an ads account. If you’re generating insufficient leads:
- Use the right keywords and engage more with your audience.
- Experiment with different types of contents and ads.
- Implement lead magnets like free guides or case studies.
Competitor Analysis
List your rival businesses and LinkedIn will automatically curate these metrics:
- Competitor Highlights: A comparison of your page’s posts and engagement rate versus that of your competitor’s.
- Follower Analytics: Your competitor’s all-time followers and net new followers within a specific time period.
- Total Posts: A comparison of total post updates in the past 30 days.
- Total Engagement: A ranking of total engagement metrics on your page versus all competitors.
- Trending Competitor Posts: The top trending posts made by competitors in the past 30 days.

Gauge whether your activity outperforms your competitors. If not:
- Analyze your competitor’s top-performing content type, post timing, and topics.
- Note what competitors offer that you don’t, then add it to your strategy if it’s relevant to your business.
Employee Advocacy
- Employee recommendations, posts, reactions, comments, reshares: The amount of times your company’s employees engaged with your posts.
- LinkedIn members reached: The number of LinkedIn members who interacted with your content as a result of your employees’ engagement on your posts.
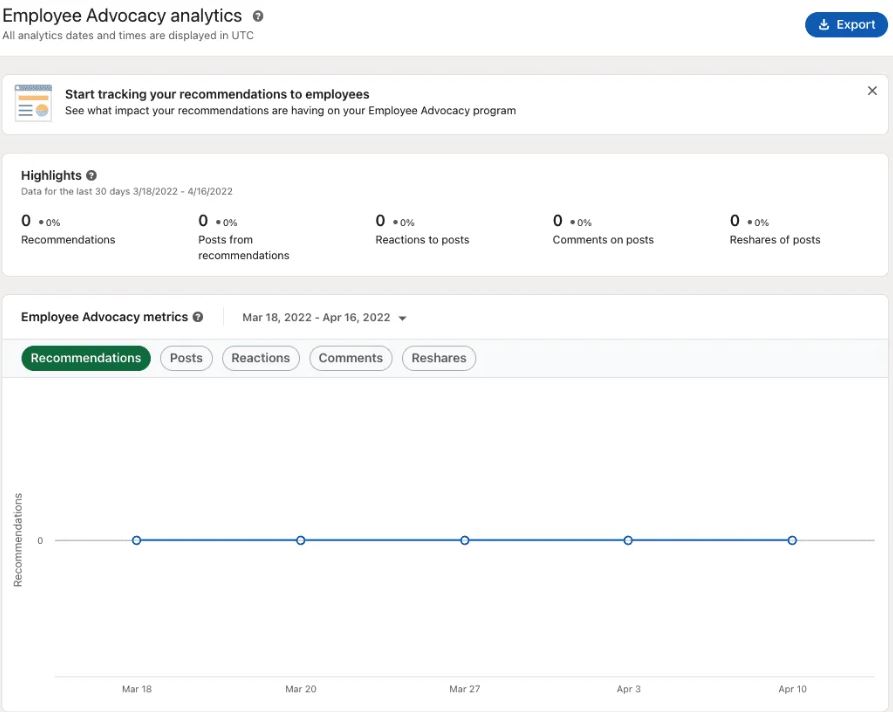
These metrics will only be available if your company page has employees.
- Create a detailed employee advocacy plan and establish a library of posts that employees can engage with.
- Include posts appreciating employees to encourage them to share your posts with their network.
Create Reports with Native LinkedIn Analytics
How to Access LinkedIn’s Native Analytics
- Open your company page
- Click ‘Analytics’ on the left navigation bar.
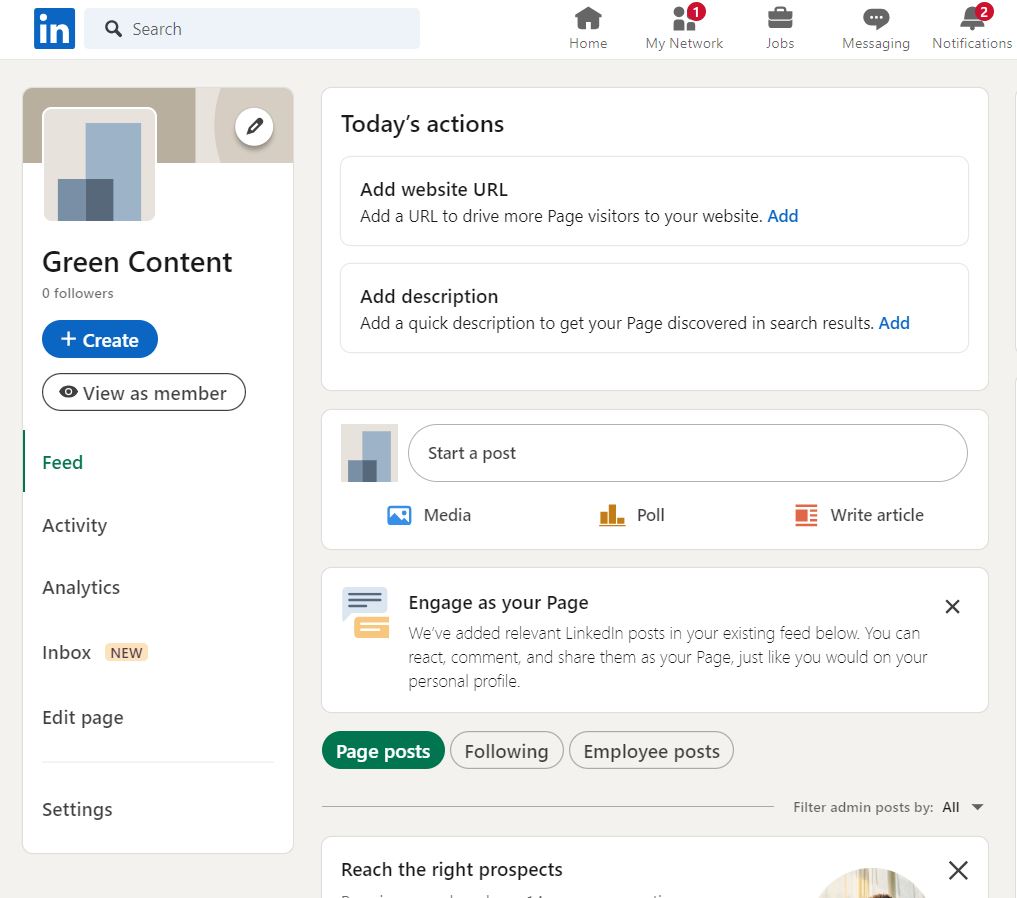
- Choose the metric you want a report on.
- Click ‘export’ under the header tag to download a .xls file containing a report on your chosen metric.
Types of Native LinkedIn Reports
LinkedIn lets you download data from its native analytics tool to measure your online performance in various reports.
LinkedIn Analytics Reports
All of these reports are aggregates of metrics over a specified time period. Users can export a report for each metric as an MS-Excel sheet that can be leveraged to perfect their marketing plan.
Content Report
- View your engagement data and use it to enhance your overall content performance.
- This report can help you measure whether your campaigns are on-track or if you need to alter your content to meet your end goal.
Visitors Report
- Check which pages get more frequent visits and how many unique visitors check out your business profile.
- Compare your pages with each other and note areas of improvement to visits per page.
Followers Report
- Track sponsored, organic, and auto-invited followers to measure your page’s growth over time.
- Tweak your content to prioritize organic followers and enable auto-invites so LinkedIn will invite users who engage with your content to follow your page.
Leads Report
- Get data on the users who fill out your lead form.
- Track signups and campaign efficacy to streamline your Calls to Action and measure how your content appeals to your target audience.
Competitor Report
- Get a breakdown of your competitor’s LinkedIn performance, engagement, and trending posts.
- This report highlights key differences in your strategy which you can modify as needed for your goals.
Employee Advocacy Report
- A summary of your employees’ engagement with your content and recommendations to their network.
- It’s advisable to create a detailed employee advocacy plan and engagement guidelines.
- Employee appreciation posts may encourage them to share your posts with their network.
LinkedIn Ads Reports
Your business can run ad campaigns on LinkedIn and get reports through the ‘Campaign Manager’ dashboard after setting up an ad account.
LinkedIn Ads Analytics include reports on:
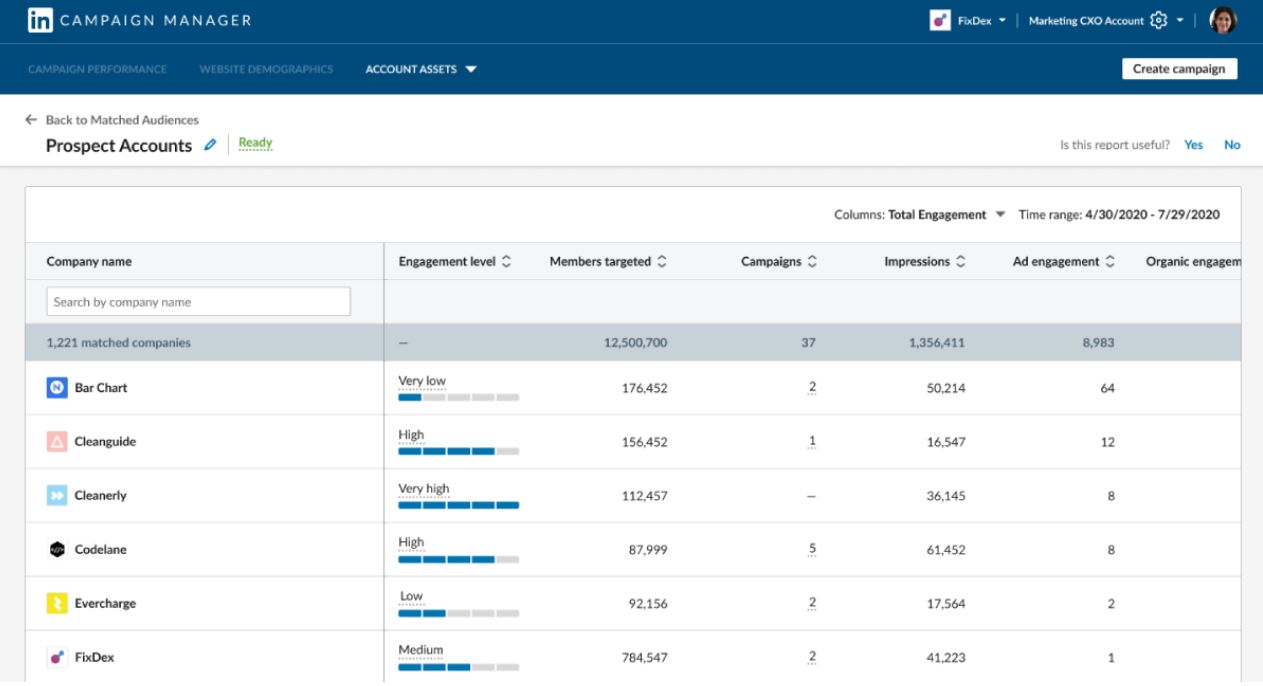
Demographics
- Access audience data to better understand their needs. This data is similar to your followers and visitors’ demographic data available in a LinkedIn Analytics report.
- Companies can use this information to tailor content to their audience and increase conversions and overall performance.
Ad Performance
- Ad spend: The total amount spent on your ad campaign
- Click-Through Rate: How many users clicked on a link in your ad
- Cost Per Click: The cost of a single click on your ad
- Cost Per Mille: The cost per every thousand clicks on your ad
- Impressions: The times your ad appeared in a user’s feed
- Conversions: The number of users who reached the end of your campaign funnel and completed the action mentioned in the post, such as a purchase or registering for a program.
- If your conversions aren’t as expected, try A/B Testing to identify what appeals to your audience
Delivery
- Get data on how often your audience sees your ads and your spend over time with metrics like reach, average frequency of how often your ads are displayed to users, and CPM.
- You can use these insights to measure your ads’ cost-efficiency and understand how they are shown to your audience.
- Poor performing ads that are displayed frequently should be replaced with better performers.
Conversion and Leads
- Measure leads and conversions with lead form opens, number of leads collected, Conversion Rate, Cost Per Conversion, Click Conversions, and other metrics.
- Check your ROI and examine whether the lead forms and magnets are working as idealized or if something needs changing.
Create Practical LinkedIn Reports with ReportGarden
As one of the leading social media reporting tools, ReportGarden offers a variety of templates and custom widgets to create insightful LinkedIn reports with impressive visuals.
ReportGarden’s templates for LinkedIn Analytics and LinkedIn Ads reports can quickly and automatically create reports once your account has been linked.
Types of LinkedIn Reports on ReportGarden
LinkedIn Analytics Report Template

ReportGarden’s software curates the data you need to understand your LinkedIn performance in a comprehensive report.
This includes KPIs like:
- Engagement
- Clicks
- Followers
- Audience demographics
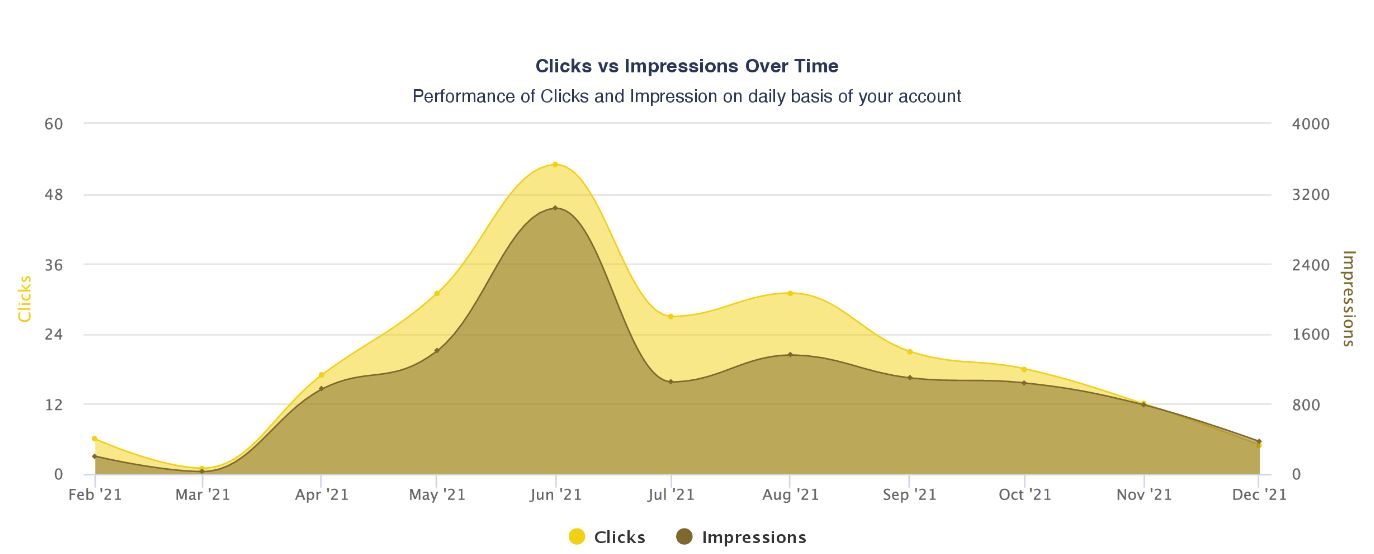
Pro-Tip: Use graphs and charts to visually compare metrics and easily identify areas of improvement.
LinkedIn Ads Report Template
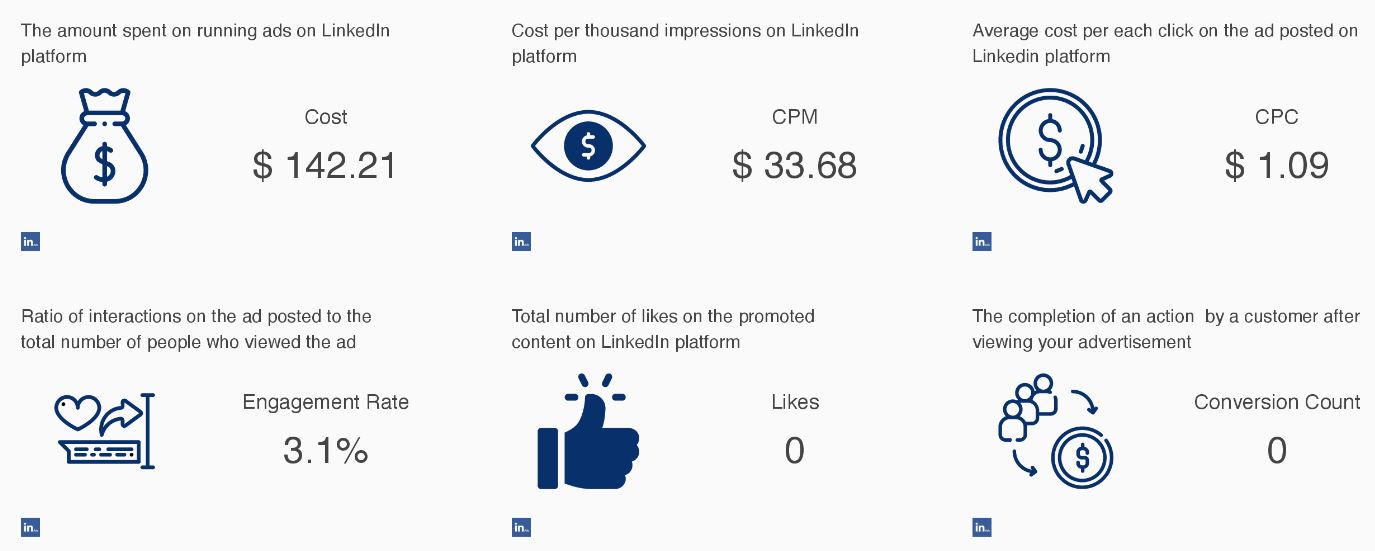
This ads report curates your company page’s ad data into a template featuring crucial LinkedIn Ad KPIs, like:
- Cost Per Thousand Impressions (CPM)
- Cost Per Click (CPC)
- Click-Through Rate (CTR)
- Impressions
- Multi-Campaign Performance
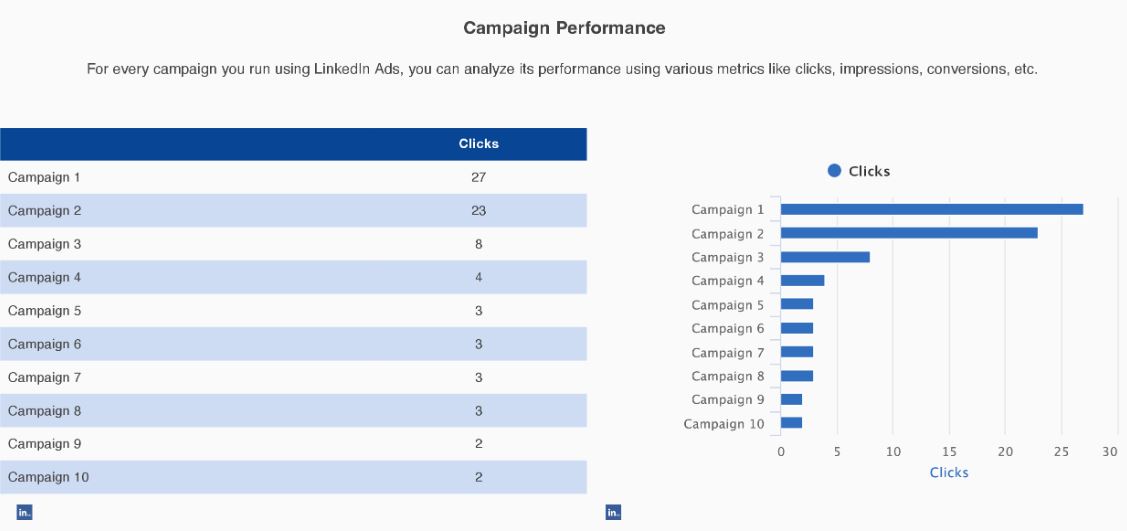
- ReportGarden lets users analyze multiple LinkedIn campaigns in one place.
Pro-Tip: Each template can be customized to include the data widgets you want to use and branded under your company’s name as a professional, white-label report.
Consolidated LinkedIn Reports for Agencies and Enterprises
Showcasing an overview of your client’s LinkedIn campaign is made easy with ReportGarden’s LinkedIn dashboard that combines data from LinkedIn Analytics as well as the Ad Campaign Manager to craft the ideal performance report.
Add or remove data widgets according to your needs and preferences and create a compelling data story with features like:
- Drag and Drop Widgets
Add or remove data widgets as you please with the intuitive drag and drop feature.
- Granular Reporting
ReportGarden integrates not just overviews but page and post-level data to create reports that dive into the microscopic heart of your campaign.
- Engaging Visuals
Use charts, graphs, and images to keep your viewers hooked as you embark on an engaging data journey.
How to Create a LinkedIn Analytics Report with ReportGarden
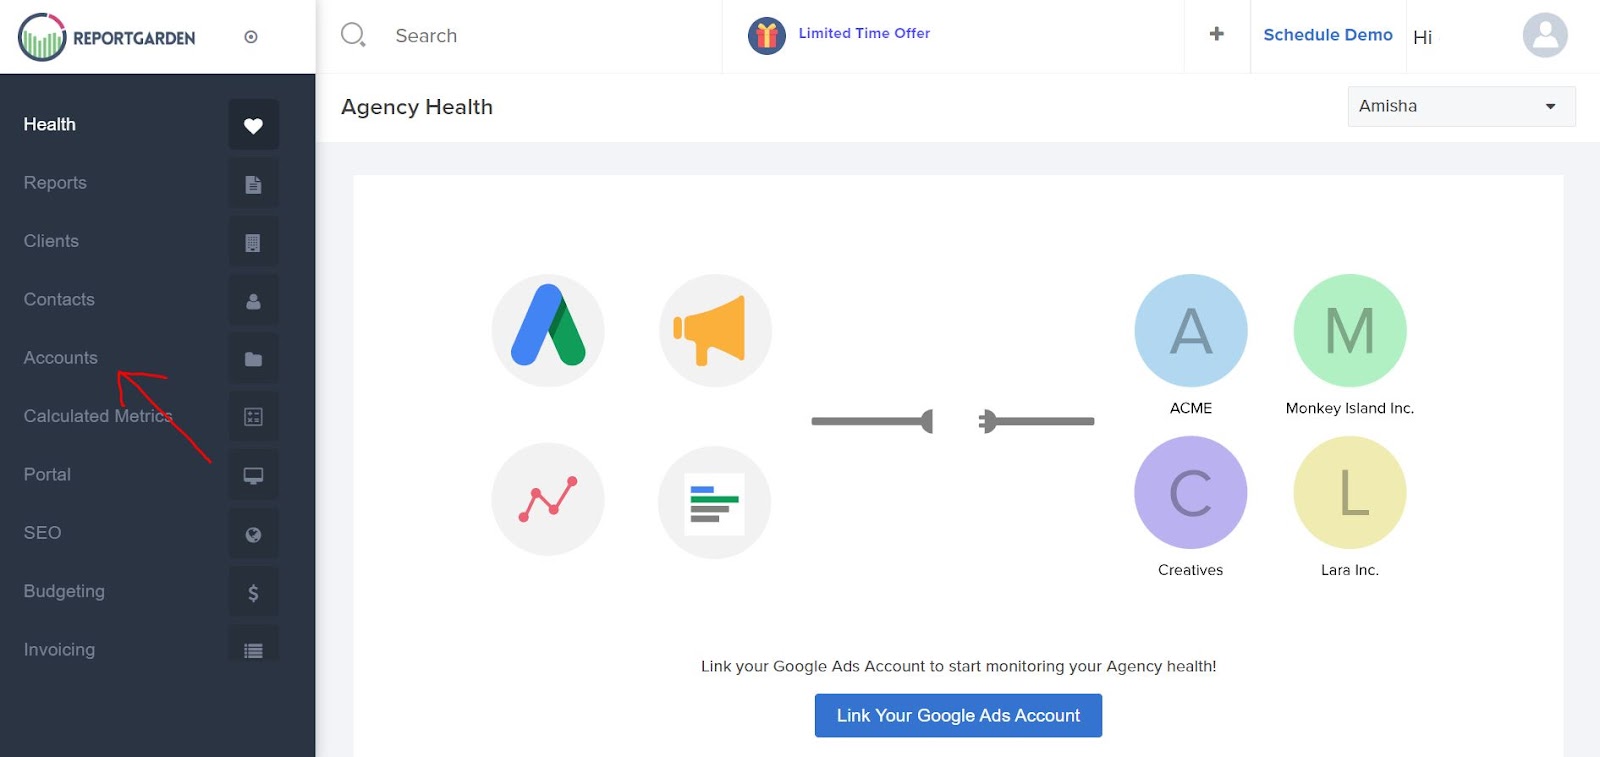
- Step 1: Log into ReportGarden and click ‘Accounts’ on the left navigation bar.
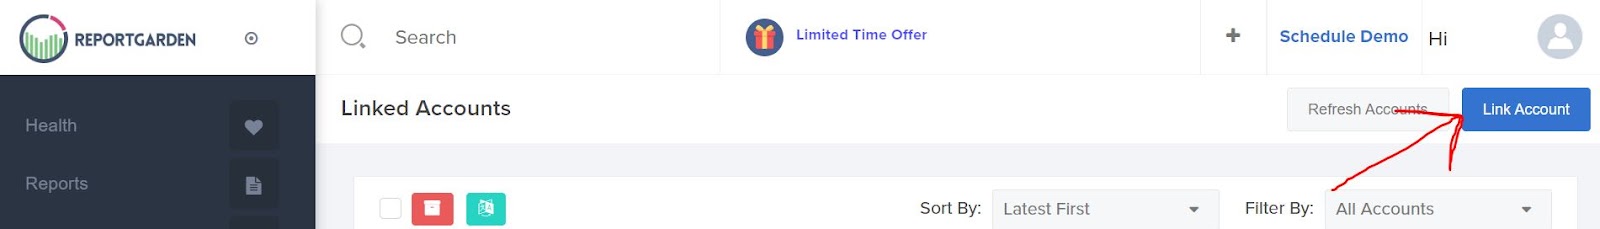
- Step 2: Select ‘Link Accounts’ and integrate your LinkedIn account
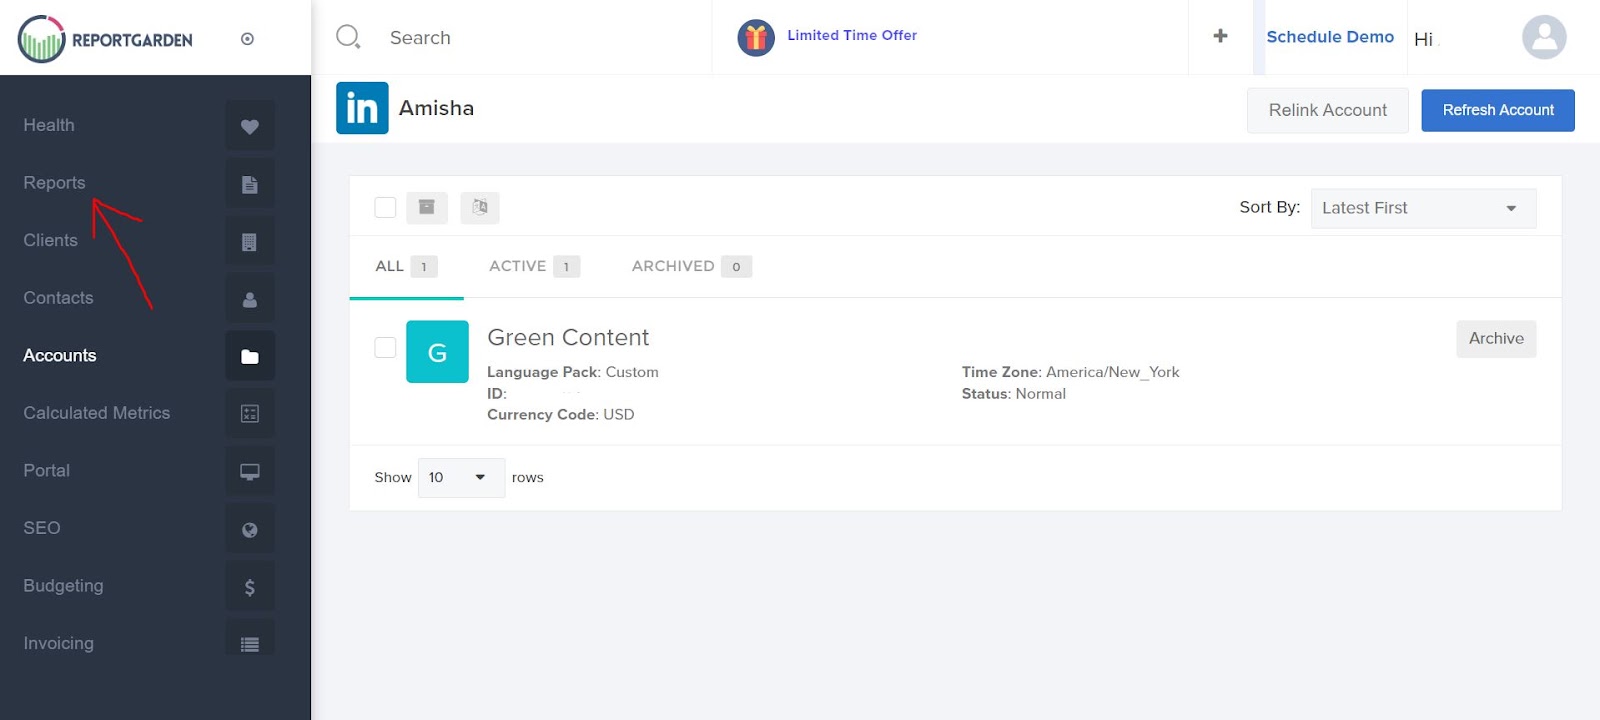
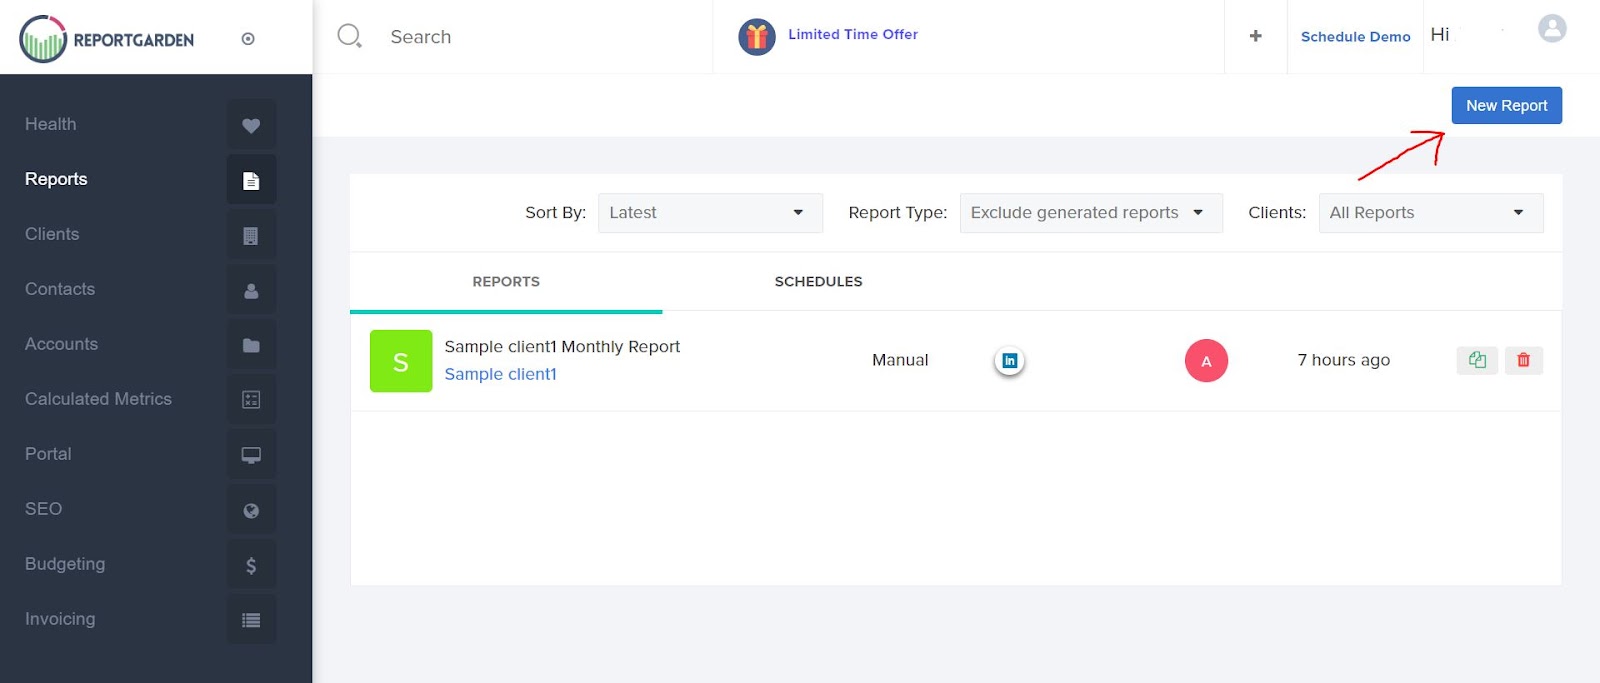
- Step 3: Open the ‘Reports’ tab and click ‘New Report’
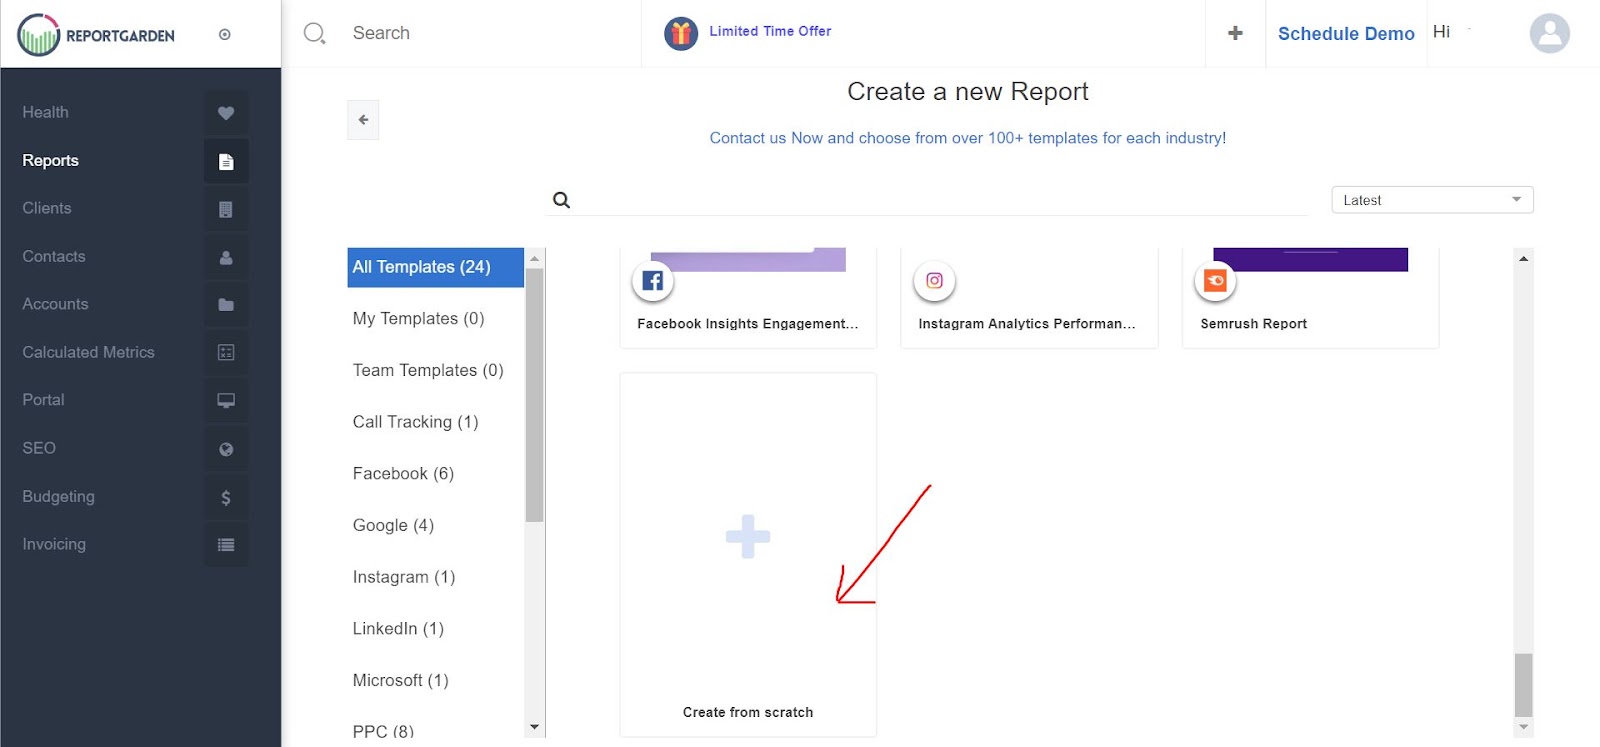
- Step 4: Select ‘create from scratch’ to access a blank canvas and begin creating your report.
- Step 5: Select the type of widget you need from the right-hand tools panel, for example: a table widget for Total Clicks on your campaign or a graph comparing your Post Performance vs your competitor’s.
- Step 6: Drag it onto the canvas and specify the dimensions, and ReportGarden will automatically fill the data in.
Start crafting your dream LinkedIn Report with ReportGarden today.
Benefits
Understand your audience
LinkedIn demographics are used to get the breakdown about who is viewing your Company Page. As a brand, you should also have an idea related to who you are speaking to – a buyer persona. The thing that matters the most is to make sure that the targeted audience is on LinkedIn by familiarizing yourself with the LinkedIn demographics.
You can get a good idea of what the potential and current customers like about your brand with the help of Visitors and Followers sections.
Connect to new prospects
A great way to connect with the prospects for the first time is thorough Networking on LinkedIn. The best way in which these prospects can be attracted is by building your brand on LinkedIn. You will also get to know everything you wanted to know about your followers through strong LinkedIn data analysis.
Replicate your success
You can easily figure out what content isn’t doing well and what is doing well with the help of insights on clicks, shares, comments, and likes. It is also an opportunity for you to decide whether you want to sponsor an update so that it reaches more people. LinkedIn Analytics also lets you know exactly the number of times you gained new followers through paid advertising.
Visualize your data
LinkedIn Analytics envisage your data so that you can see a glance of your social media performance. It also makes easy the identifying trends such as spotting any spikes or dips in your data.
Attracting top talent
LinkedIn is also used by many top professionals as an opportunity to look for new careers. LinkedIn will also help you to attract the best of the best by building your own credibility.
Branding
LinkedIn solidifies your brand and boosts your credibility by building a strong presence. People can easily locate you online on search engines and LinkedIn itself. This will further enhance your brand.
Increasing engagement
LinkedIn Analytics is considered as a great way to gather information related to your customer. Competitive analysis will also depict exactly how they are interacting with colleagues, competitors and other brands.
LinkedIn content is considered as a great way to build branding. A number of ways to improve and measure content campaigns are offered by LinkedIn analytics tools. Boosting your SEO is also possible by using LinkedIn for building your brand. Often in search engine rankings, LinkedIn content and LinkedIn company profiles appear high. More visitors will be driven to your brand by strengthening them.
Takeaway
A prominent LinkedIn presence has the potential to elevate any brand’s marketing and overall performance, but building the mansion of an ideal marketing strategy would be impossible without the blueprint that LinkedIn Analytics provides.
Assessing your posts and campaigns and improving poor-performing metrics pave the way to a highly successful, evolving strategy that carries your business to the forefront of its field.
LinkedIn’s native analytics tools make it easy to obtain this data, but these reports are limited to obsolete MS-Excel files that need to be manually combined for reports. Take hours of time off your workload and make reporting easier with ReportGarden’s automatic and customizable LinkedIn reports that consolidate all your data in one place.
Make stunning reports the right way with ReportGarden. Begin your Free Trial today! (No credit card required).
.png)


