Is your client being extremely creative in their content yet struggling for the reach and number of followers?
Performing an audit for multiple channels and crafting analytics reports surely gives you crucial information, but it might feel overwhelming.
What if we told you it’s possible to conduct an audit within an hour? And no, we won’t be skipping any important steps. We can help you identify the 20% of your social marketing efforts that drive 80% of your business results and thus streamline your strategy for maximum impact.
Adding more to your comfort, how about a social media audit template that is extremely easy to use, not visually crowded and simultaneously highly informative? We cover how to catch up with all of it in detail below. So, let’s begin solving your problem.
What is a Social Media Audit?
An audit often involves manually exploring your clients’ previous ad campaigns and attempting to put together some insights based on intuition. It involves looking for trends and key parameters like overall return on spending and other useful insights. The social media audit helps uncover the flaws in current strategy and find or derive ways to fix them.
Advantages of Social Media Audits
The advantages of conducting social media audits are the following:
- Gives a Substantial Solution in Decision Making
Businesses often face critical questions, such as which channels are driving the best results, how social media accounts are performing, which platforms to prioritize or discontinue, and where to invest the most time and resources. Addressing these questions effectively requires a thorough audit. They offer insight that can help create an optimal strategy to enhance presence on different social media channels.
- Offers Sustainable Plans
With poor reach and a focus on low-priority tasks, putting in effort is neither possible for a longer duration nor fruitful. Audits help decide sustainable plans through the identification of issues hindering the results. Plans can further be implemented and modified in the long term to offer consistent results.
- Evaluate Adherence to Goals
Regular social media audits offer insights into the KPI figures with comparative and contextual analysis. It allows monitoring, modifying and evaluating the adherence of ads, campaigns and other strategies to provide results as per the brand’s goals.
Steps to Conduct an Insightful Social Media Analysis for Business
Let us elaborate on the stepwise procedure involved in conducting social media analysis for business.
- Enlist all the channels harboring your social media presence
It is the simple task of aggregating links from all the social media channels you have across different platforms. The prime reason to do so is to identify the fake accounts running by your name or to know the ones that have been inactive or forgotten for a long time. It is also done to filter out the accounts that still generate results, as well as the platforms that aren’t popular now. In the latter case, social media channels on such platforms need to be closed.
- Take a Glance of Each Account
This step encourages taking an overview of the account to know if they are updated or not. It is recommended that the changes be incorporated during the visit. The aspects to check here include verifying.
- Does the social media handle go by your brand name or not?
- Does the profile and cover pictures match your brand’s identity or not?
- Does the bio cover relevant details like your services, working hours, communication channels and any other special or unique information?
- Are all the present links functional and updated? Do they take customers to the latest offerings or services provided by the business?
- Thoroughly Analyze Social Media Analytics
This step requires you to either go through each of the metrics manually or one by one, followed by uncovering the relationship or pattern among them. Alternatively, you can get help from distinct social media analytics tools and templates. Combining the information aids in finding the answers to important questions such as the best time for posting the content, the posts that perform exceptionally well and other aspects. Insights into automatically and regularly updated key metrics can offer required details.
- Assess Your Social Media Audience
The next audit step will be to explore your audience. You will be looking for the number of followers, monthly growth in their quantity, age, gender, location, and other relevant information. It helps to decide the content accordingly and tailor content specifically to the preferences of your audience's age group.
- Listen To Your Customers
Knowing what customers say about the brand is the easiest way to look into their concerns and improve. The social media sentiments need to be evaluated through listening tools and updates on associated hashtags and content topics. Alternatively, reviewing the reviews, comments, third-party mentions and other similar information also helps you listen to your customers.
- Evaluate Your Expenditure and Return
Now, evaluate the different types of profit you have gained through the ads and campaigns. It can be in terms of monetary returns, number of followers, leads, conversions or any other benefits. Further, calculate the return on ad spend (ROAS). It will help you decide which ad you wish to keep running and which one to stop. You can also redefine your ad strategy accordingly.
- Checkout Your Competitors
You will also want to remain ahead of your competitors. Incorporate strategies that work for them or devise ways to stay ahead. Look out for their content and leads and identify their strategy, strengths and weaknesses. You can also take note of their post timings, frequency, engagement strategies, type of content with maximum engagement, sentiments and other details.
- Define Your Goals
Knowing where you stand, the reasons for your rank and certain ideas to improve and enhance your presence, now is the perfect time to set new marketing goals. It is advisable to follow the SMART approach, where you will work on each letter of this acronym. Here is what it means:
S for Specific: You will specify the goal you wish to achieve. It can be a particular type of figure or position in your goal map.
M for Measurable: Identify the metrics, parameters or other methods to measure the progress expected from the new strategy.
A for Attainable: You will evaluate if your newly decided objective is realistic or not.
R for Relevant: You should be able to directly link the benefit of your goal with business requirements and objectives.
T for Time-based: You need to know the time it will take to achieve your new goal. Obviously, it shouldn’t be too long.
- Decide the Metrics
While there can be multiple metrics, focusing on the few important ones like reach, engagement and conversions is essential. The reach includes a number of people that get to view your social media content. It can be further checked by impressions, share of voice, audience growth and total number of followers.
Engagement refers to interactions with your social media content. It can be in the form of likes, comments, shares, mentions and clicks. Further, the conversions are the people responding to your call to action. It includes click-through rate, cost per click, bounce rate, social media conversion rate and cost per thousand impressions.
- Repeat the Procedure
Since the market is dynamic and your competitors always find a way to get ahead of you, your strategies definitely need to change with time. So, re-evaluate or audit to discover the opportunities you can grasp. Focus on the metrics, explore new trends and modify the strategy accordingly.
Facebook Ads: Social Media Audit Template Example
We will be using Facebook Ads as an example, but you can select the data source of your choice.
Facebook Ad Performance Overview
The template can be modified by adding your brand logo. This overview report sheds light on average and total expenditures to develop a strategy accordingly.
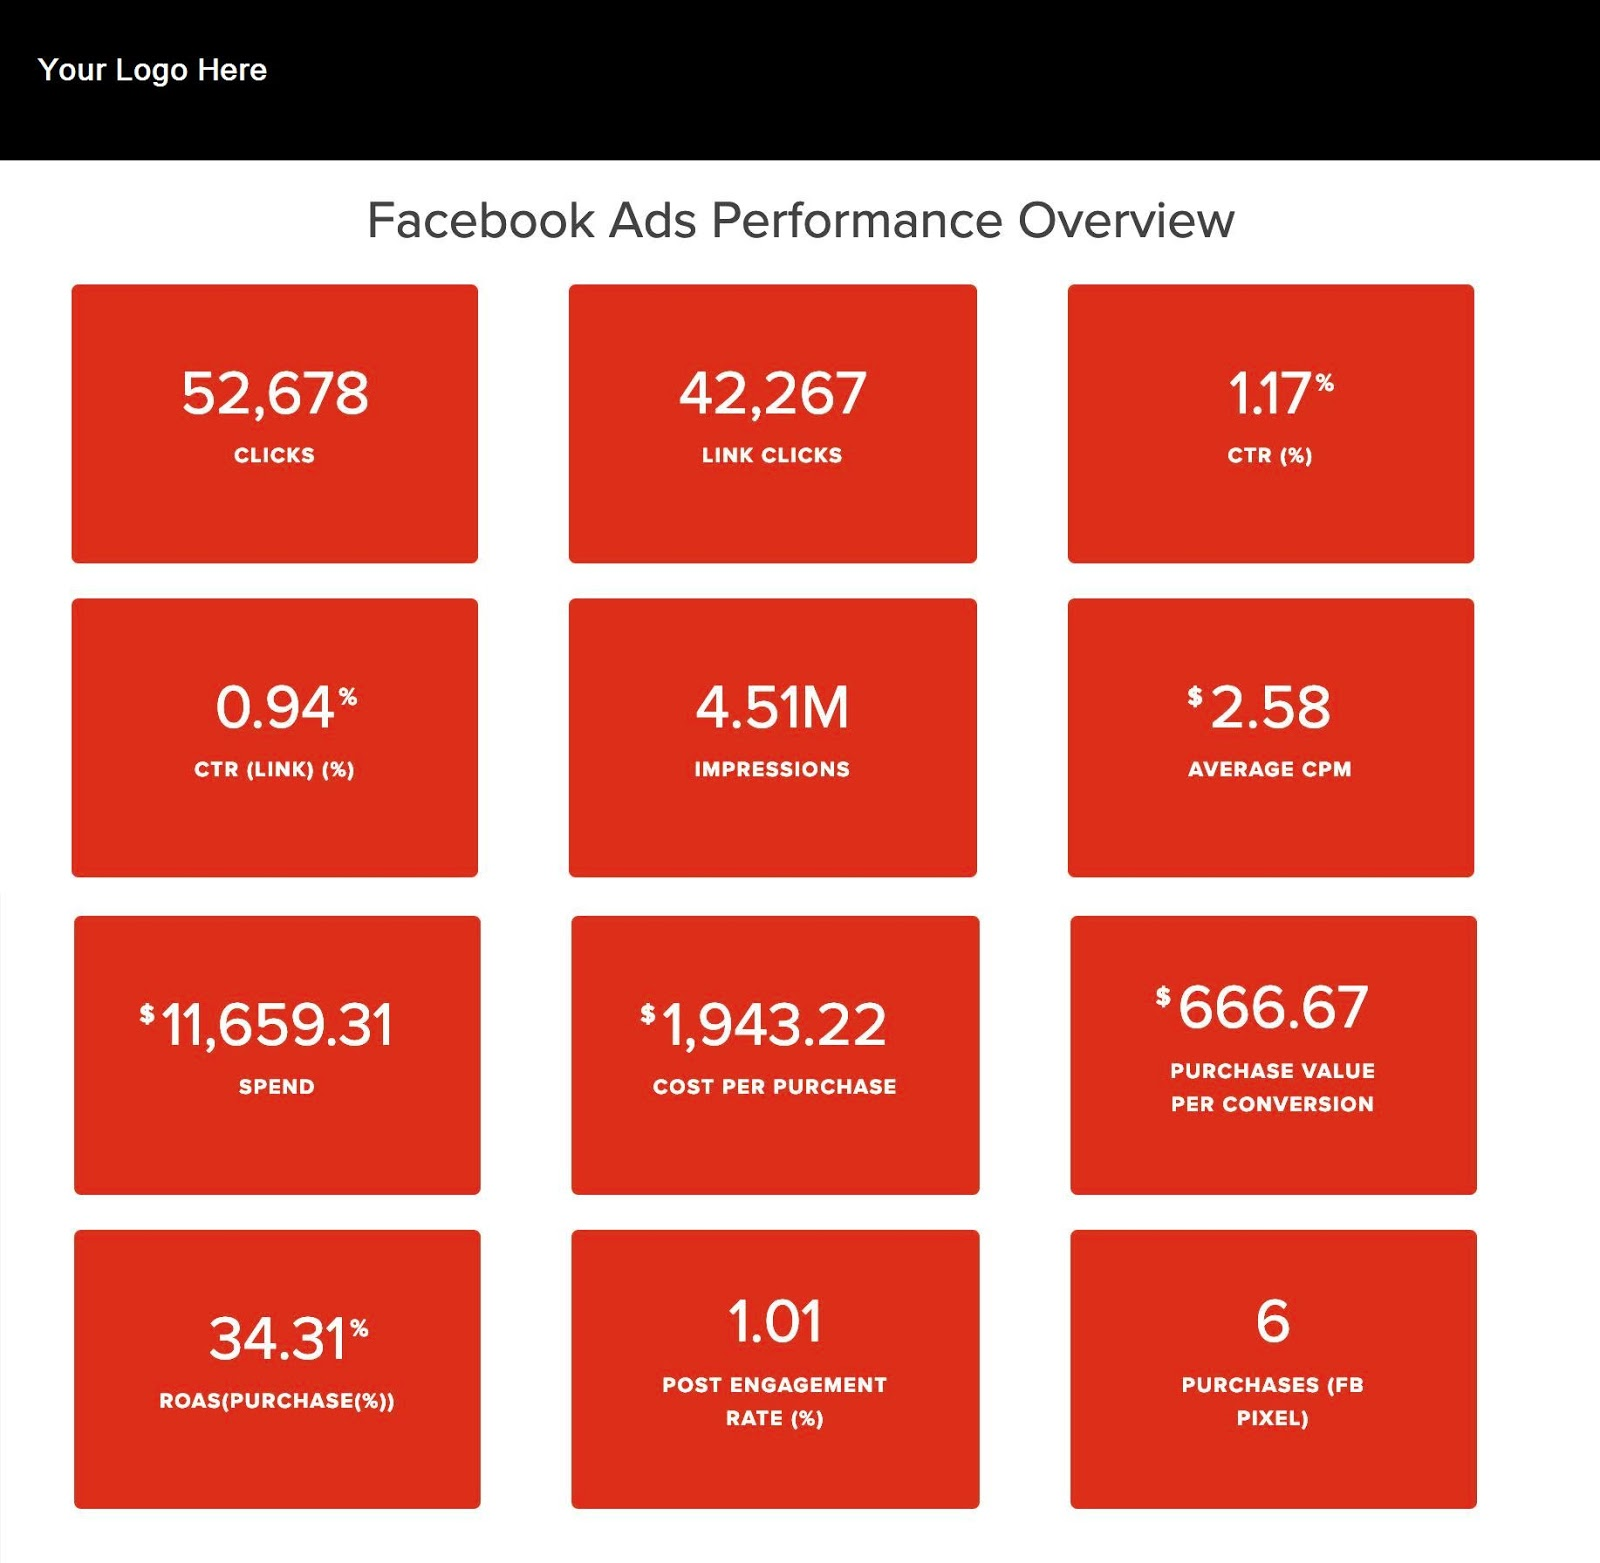
To set up that report, open up a new template and then begin filling in the data. Here’s what the general view looks like (note that this example has a style set to “Chic” for the performance overview). You can pick any dual-color combination that suits your fancy.

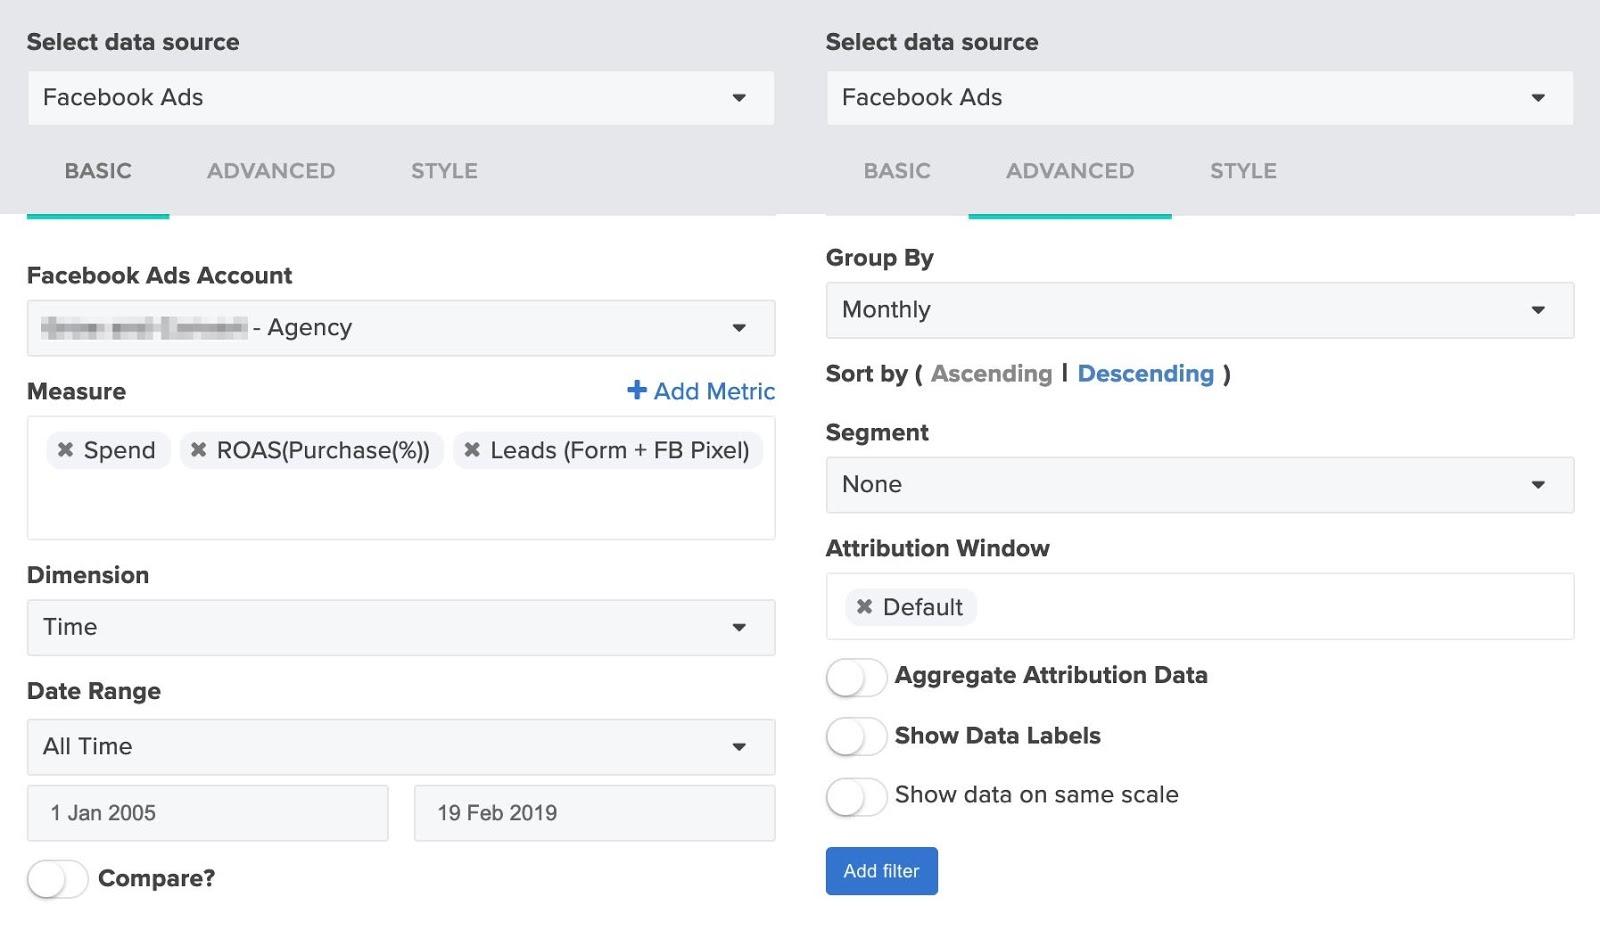
Using the options on the right-hand side of the tool, make the following selections:
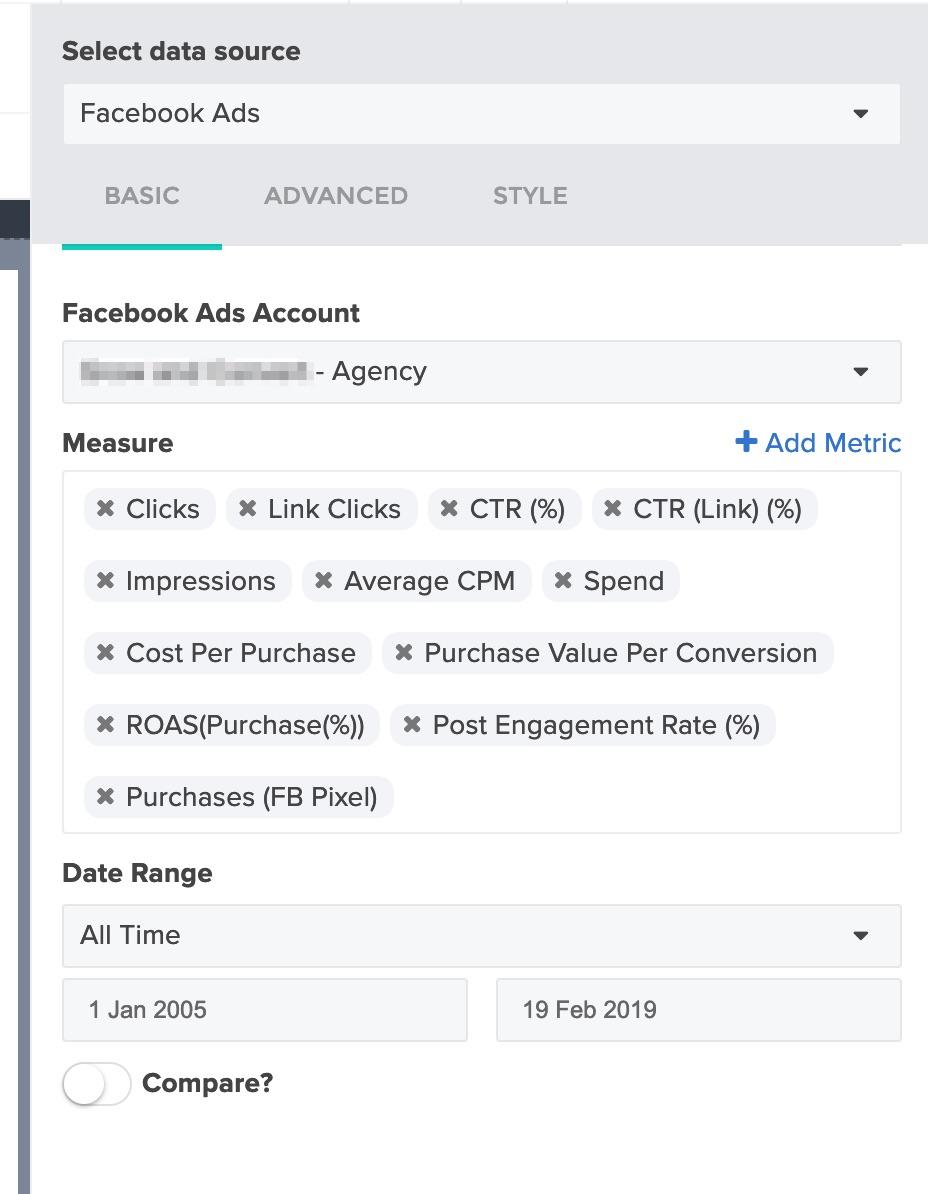
For the ‘Facebook Ads Account,’ select an account that has fairly average data to double-check parameters as you build the template. Make sure you choose a date range that will populate the graphs, charts, and tables with data. Once it’s complete, you can use the template to generate a report for any Facebook Ads account.
Monthly Performance
The next snapshot shows month-over-month performance. Report Garden comes with a drag-and-drop menu on the left for template elements like charts, graphs, and tables.
Here’s what Month Over Month Performance looks like once it’s published in the report.
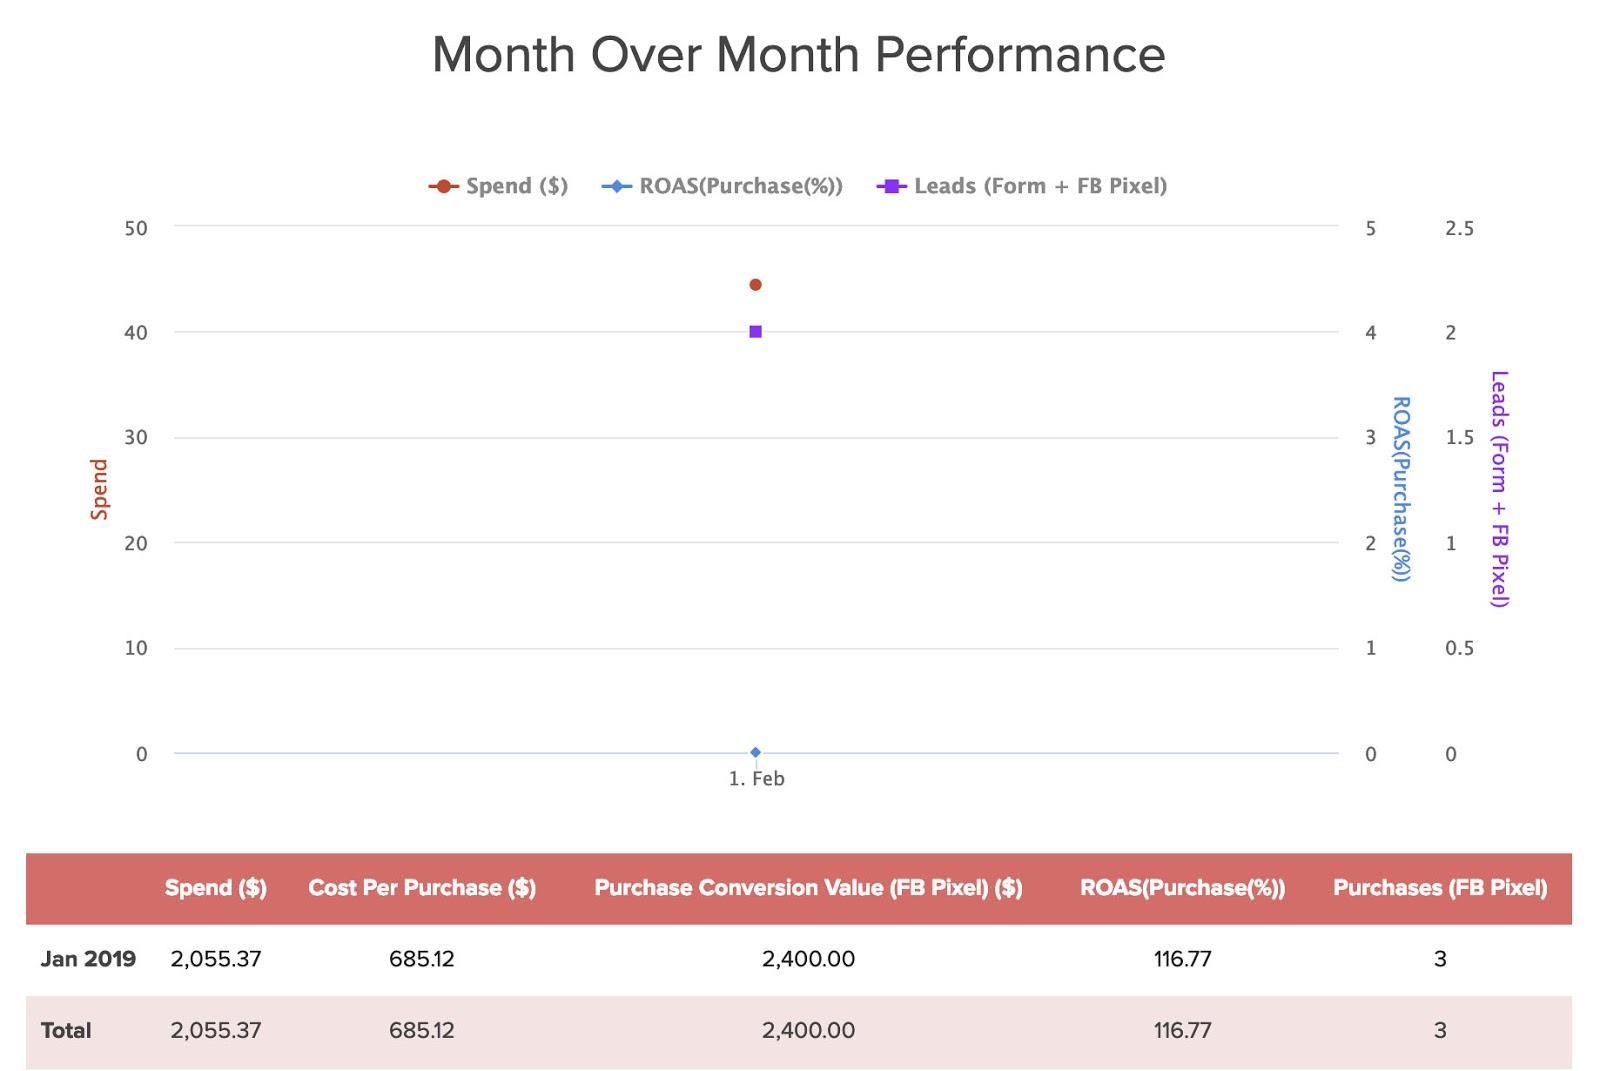
In this example, note that there is only one month to display — February — because the campaign only ran for one month. For ongoing campaigns, the monthly trends are easy to see on the graph. If you want to copy this page of the template, here are the parameters you will need:
Demographic Reach
The next part of the template shows which demographics are responding to the prospect’s ads. Displaying this information helps you show prospects which age ranges are the best to target with social media ads.
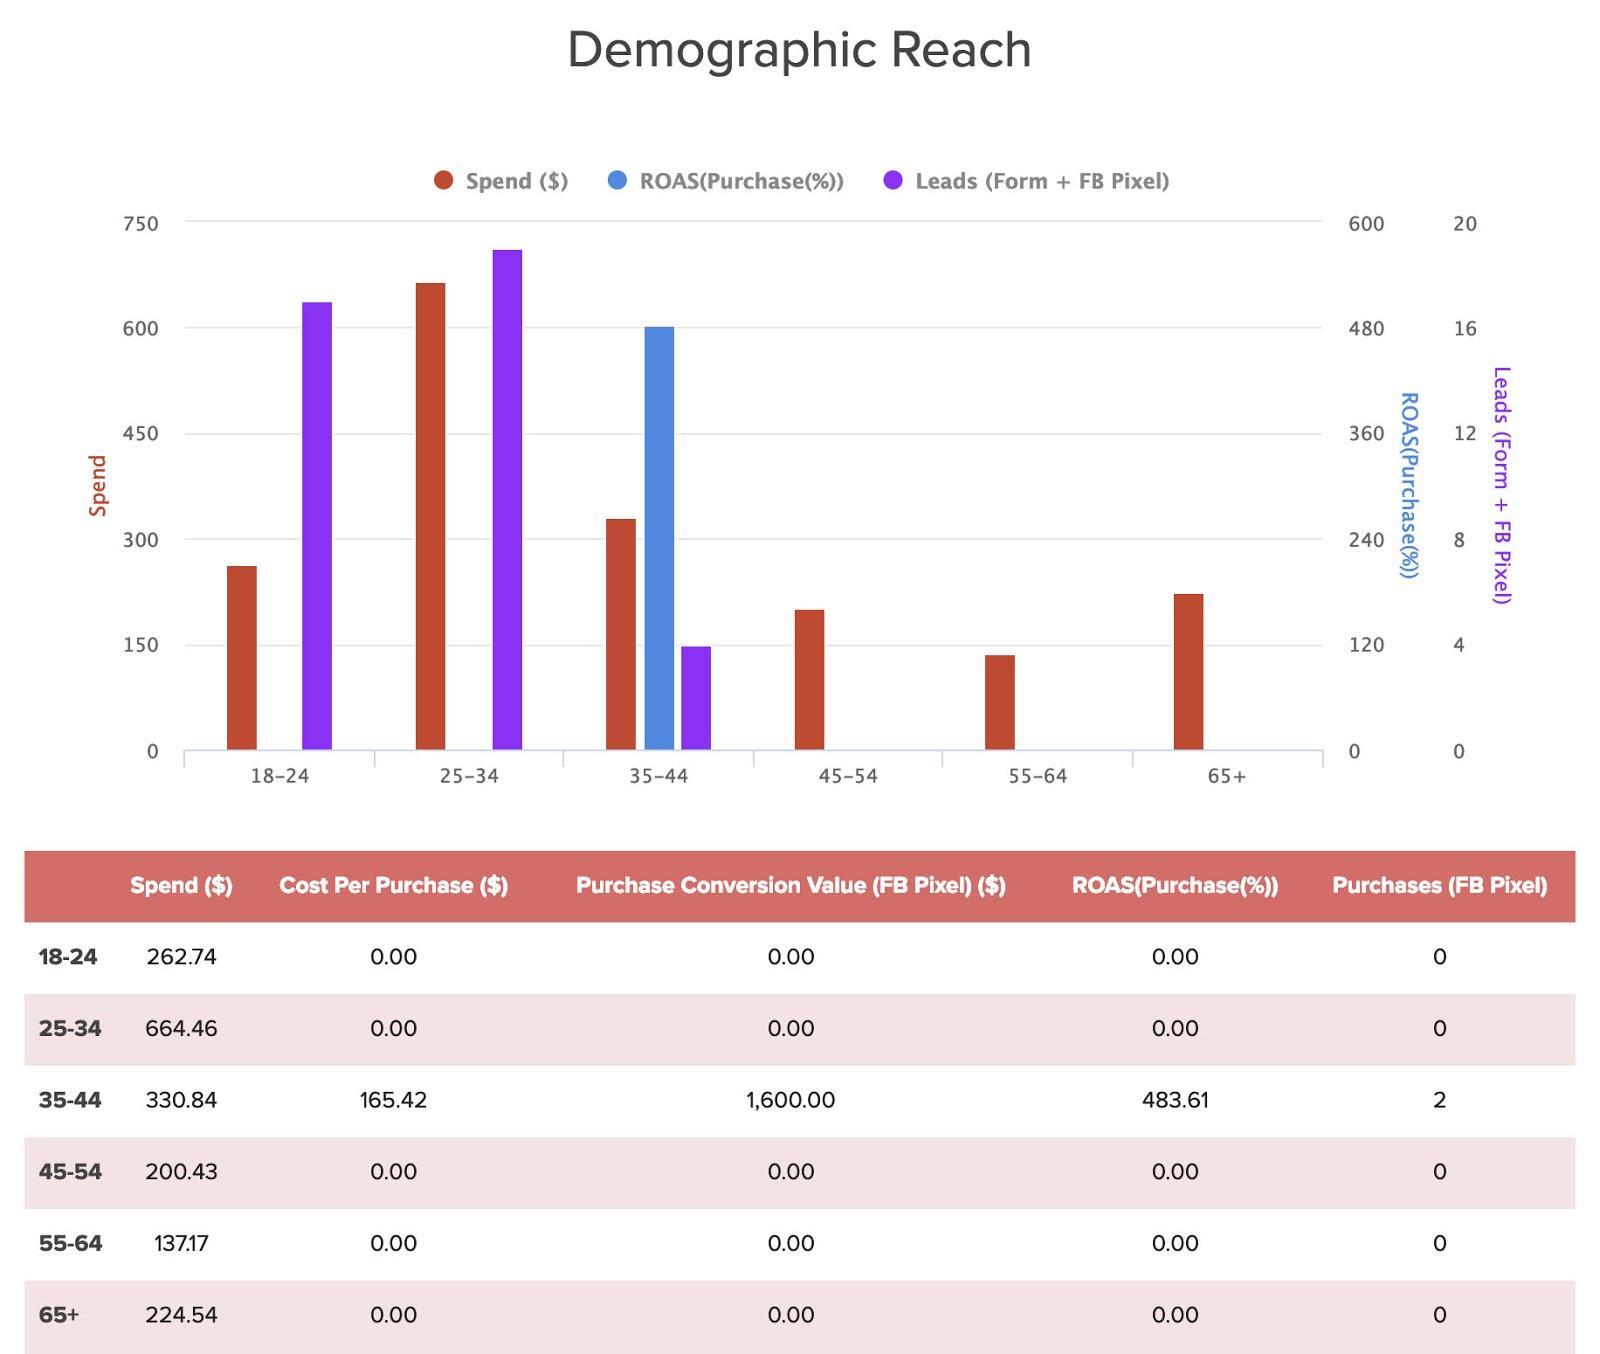
Notice that the charts have fewer categories than the tables: That’s not by accident. Including all the information you want to present in the chart would make it impossible to read. Instead, choose the information you believe is most important to feature on the chart while including additional categories in the table. In this case, you can use the options on the right-hand side to select the categories you want to display, as before. Note that under the ‘Advanced’ tab, you’ll want to have data sorted by dimension.
Gender Targeting
Another category you can include is gender targeting, i.e., which genders are responding to the content in your ads.
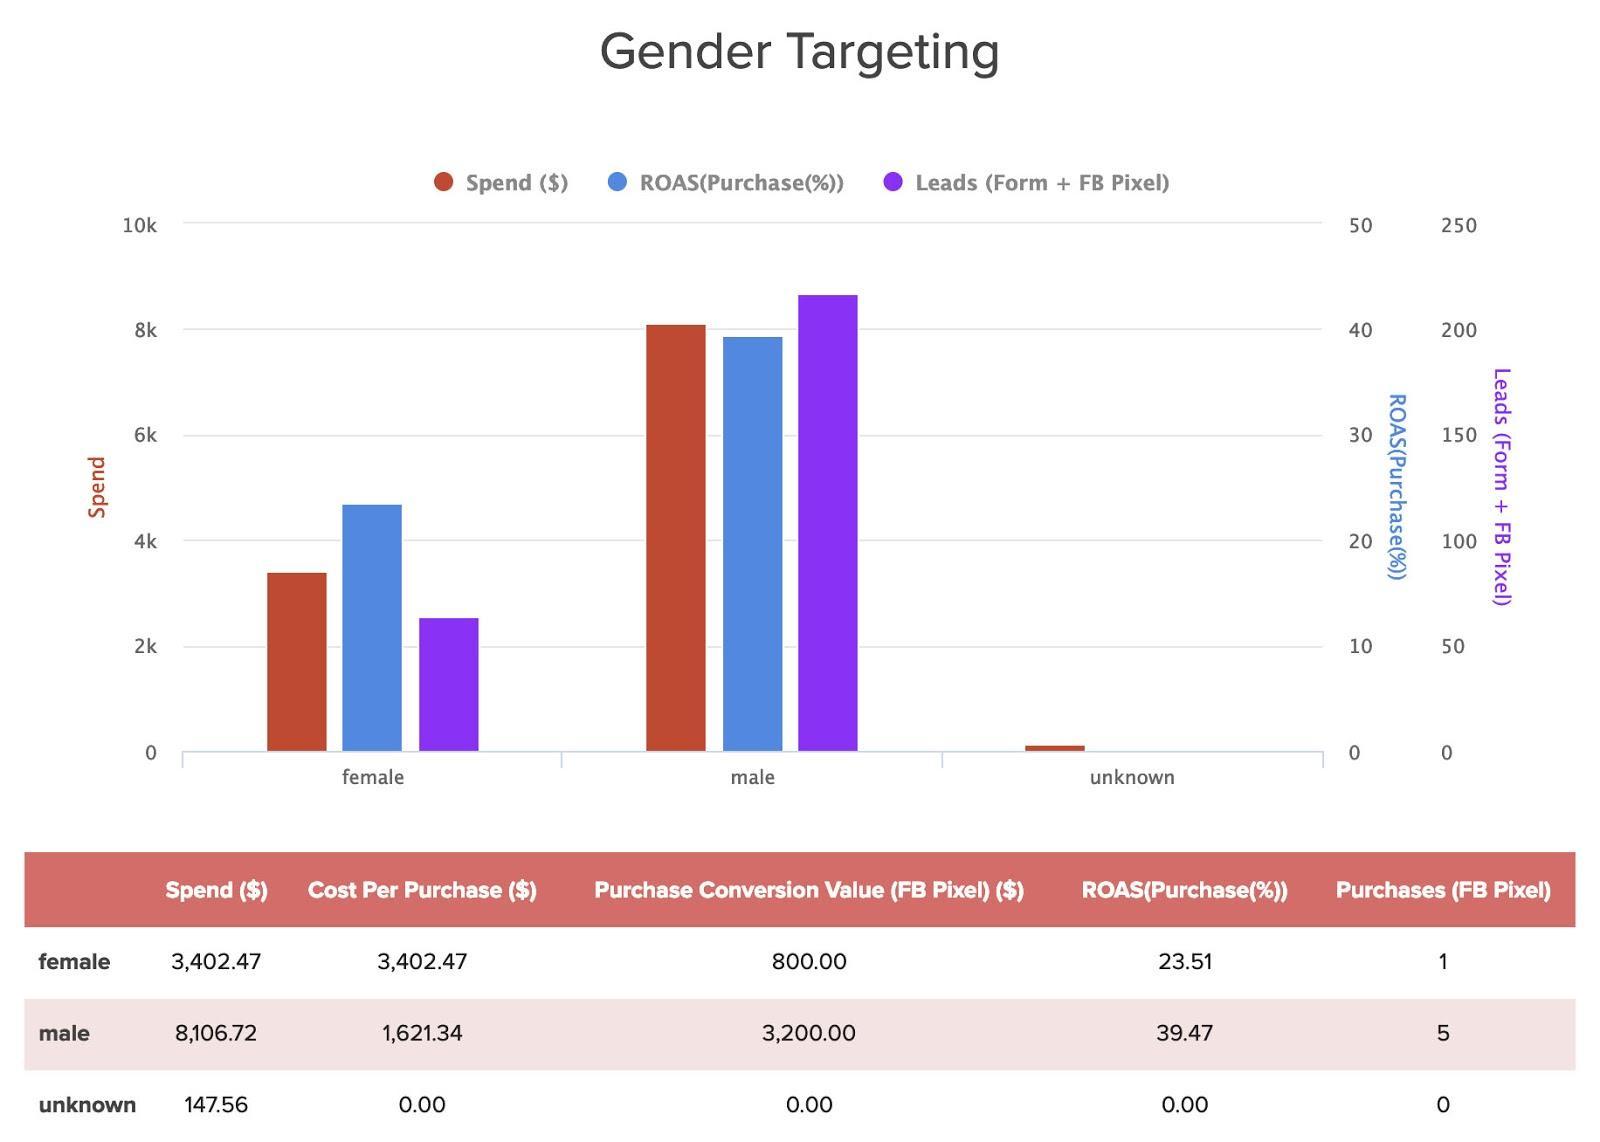
Here’s what it looks like for the chart (on the left) and the table (on the right):
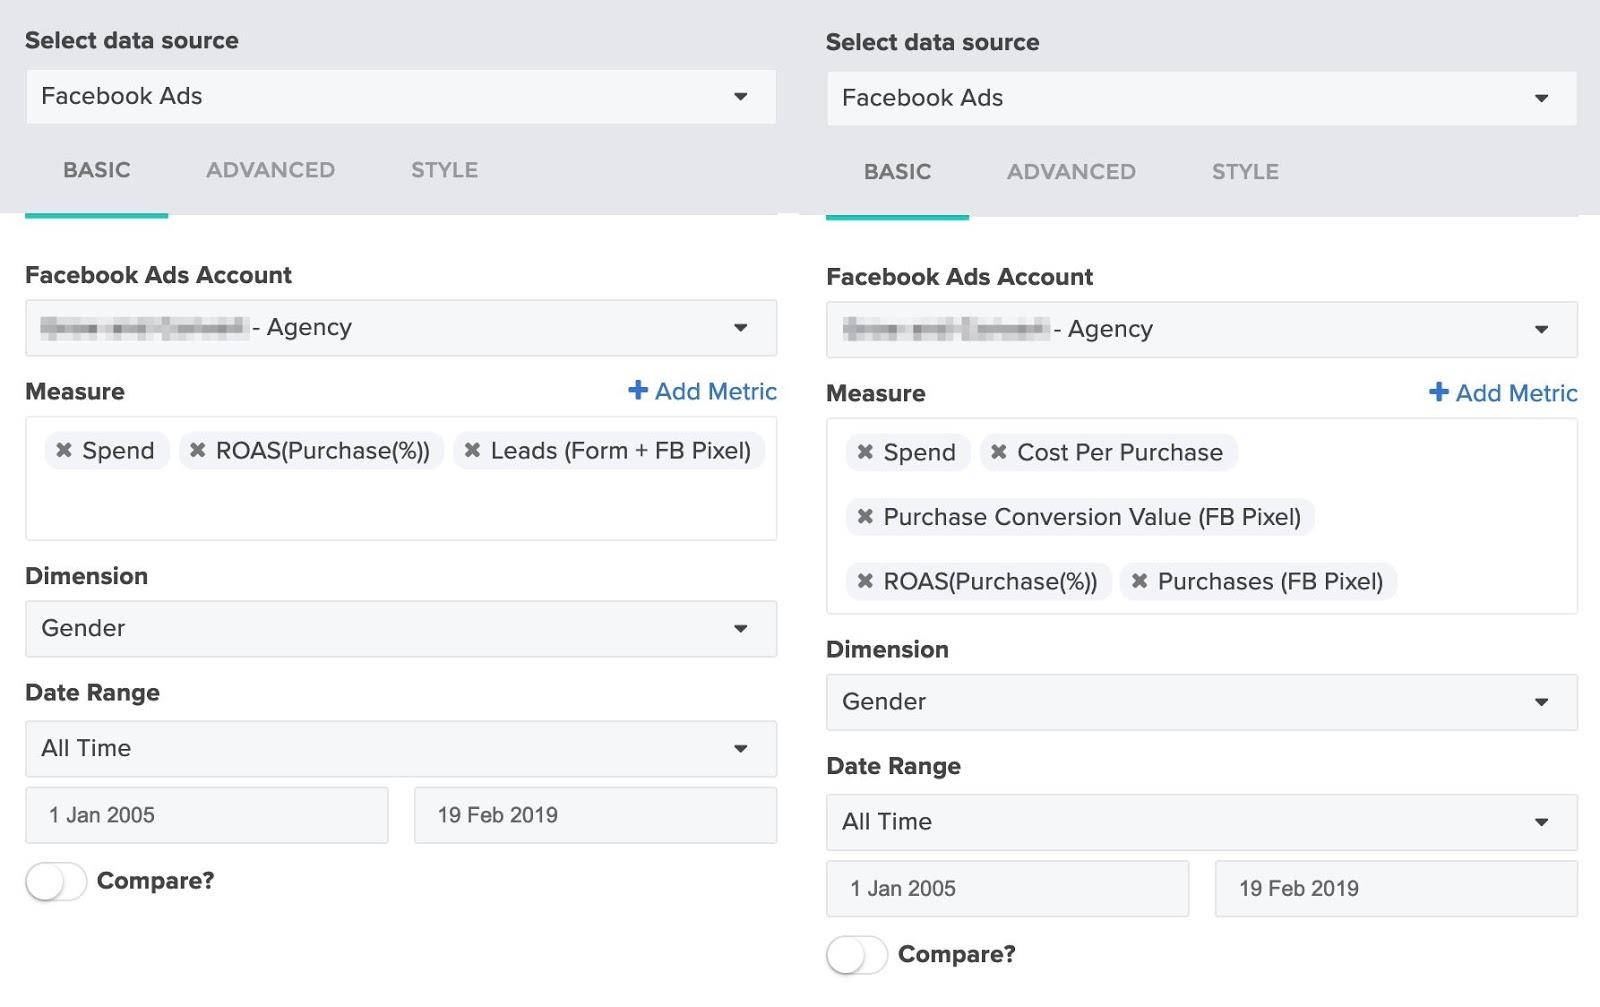
Placement and Device Performance
In this part of the report, you can show prospects which devices are being used to consume their content so that they can adjust strategy accordingly.
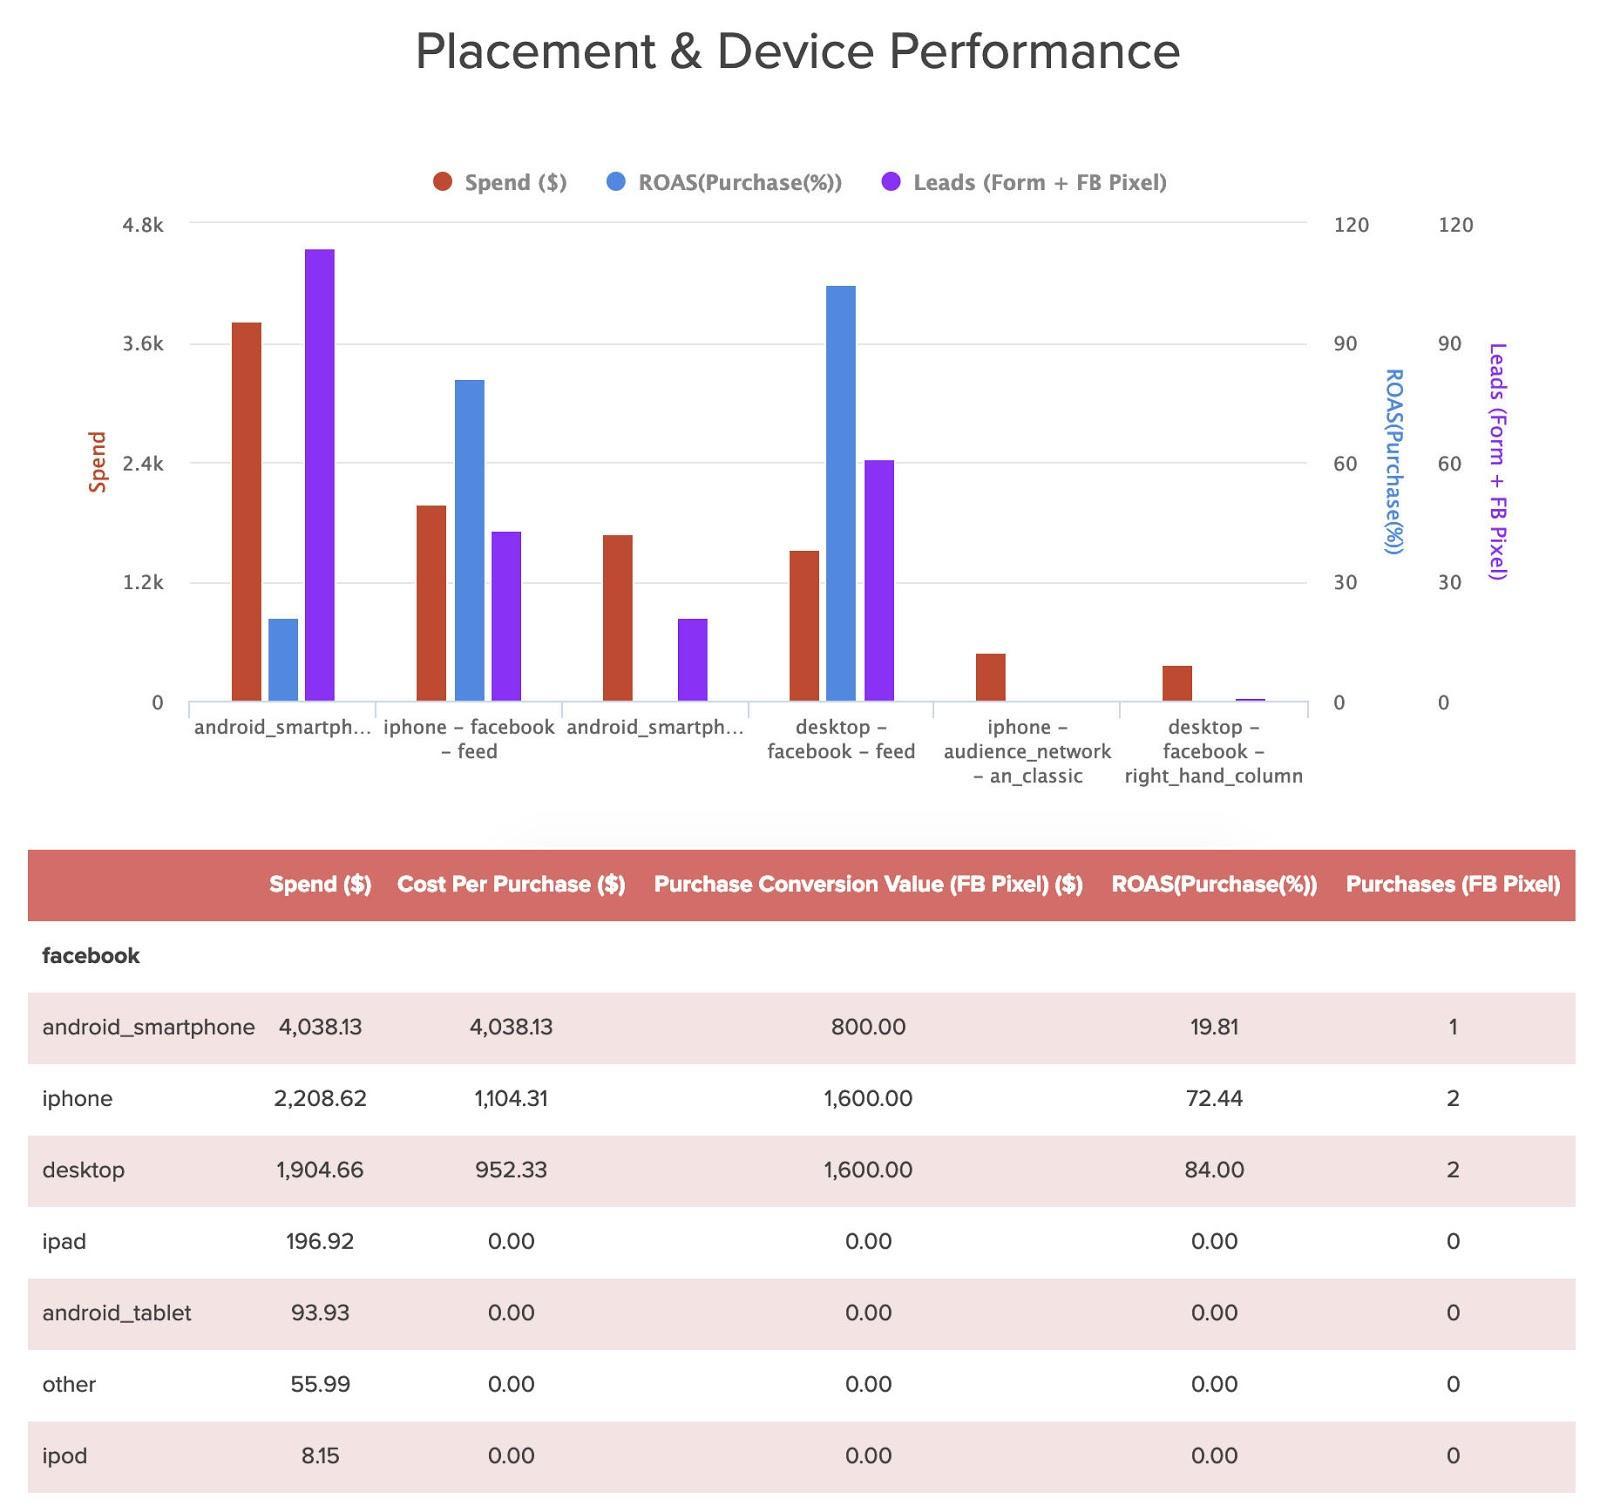
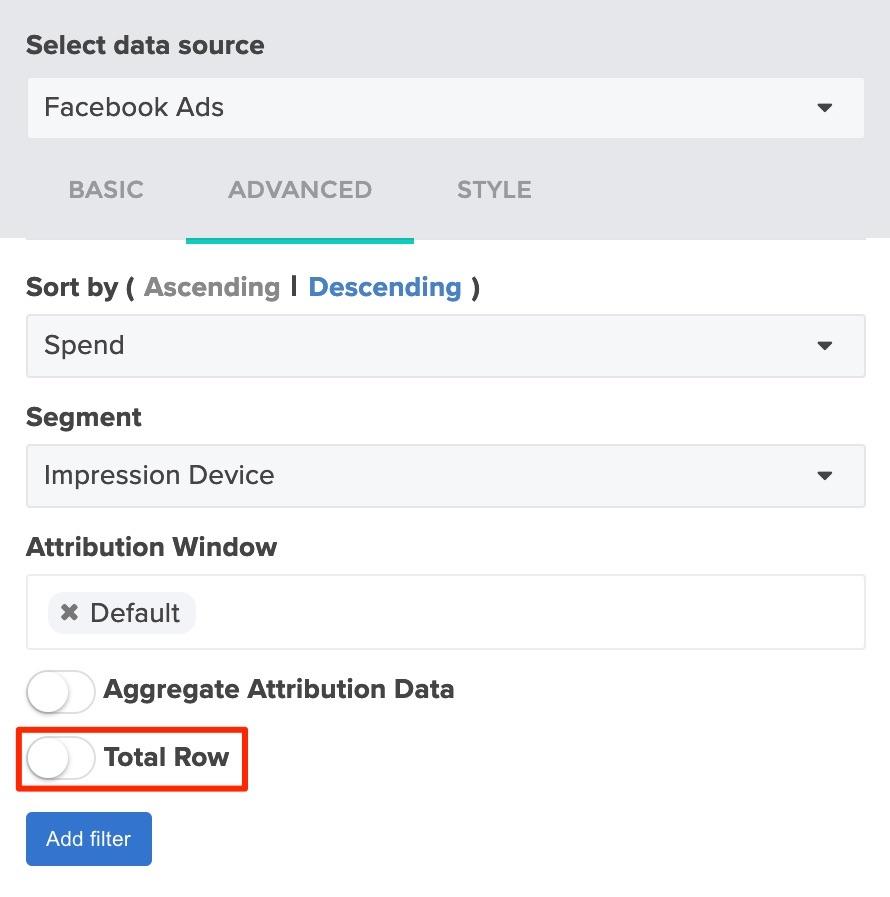
For the campaign in our example, you can see that ads were viewed primarily by people on a smartphone. Using the advanced tab, you can choose the number of rows shown based on which device types have significant data. If you only have four device types that have any noteworthy results, there’s no reason to show data for ten different device types. Other settings are selected, as noted previously. For the table, you can use the advanced tab to sort results by whichever data point is most relevant. In this case, we sorted by spending and segmented by impression device. Toggling “Total Row” off will make the table more readable.
Facebook Campaign Performance
If you want to break down performance by campaign, you can include that as well. If a company has been running multiple campaigns (not uncommon), it will help you answer the question of which campaigns did better and why.
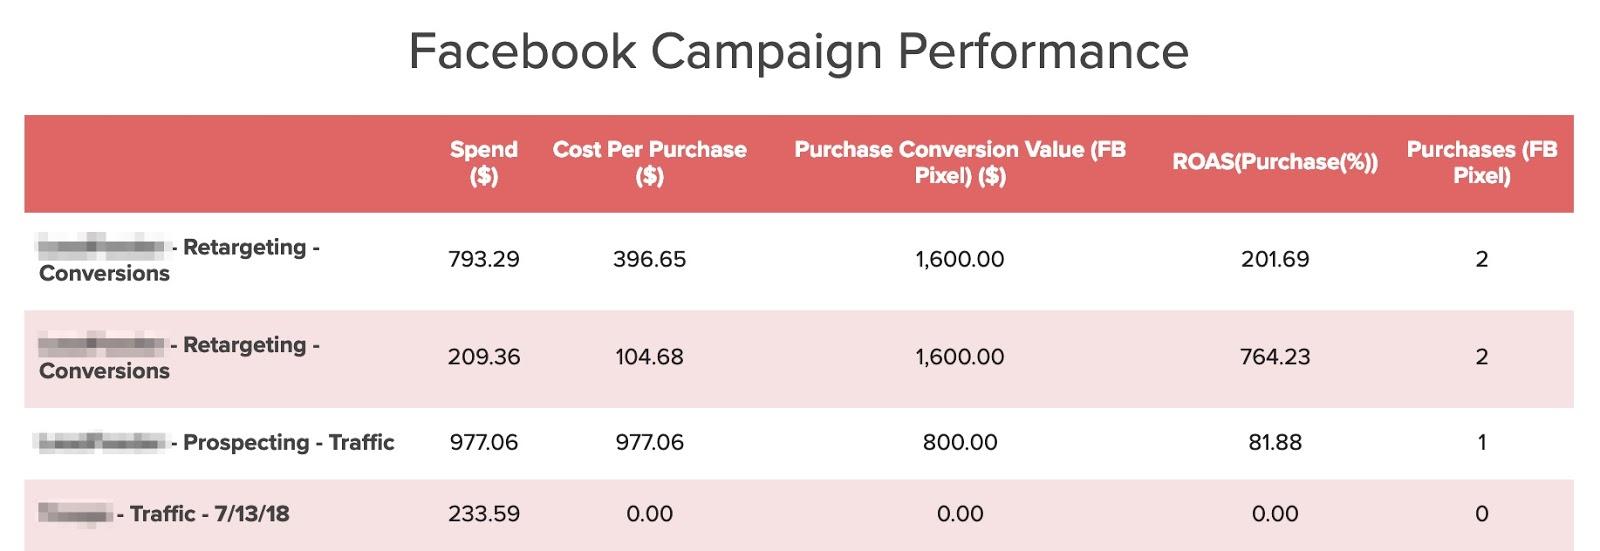
You can use the advanced tab to sort data by metrics like Purchase Conversion Value or Spend.

Country Performance and Regional Performance
Geographical data can be broken down by state and country if relevant. Here’s what it looks like if you break down performance by country.
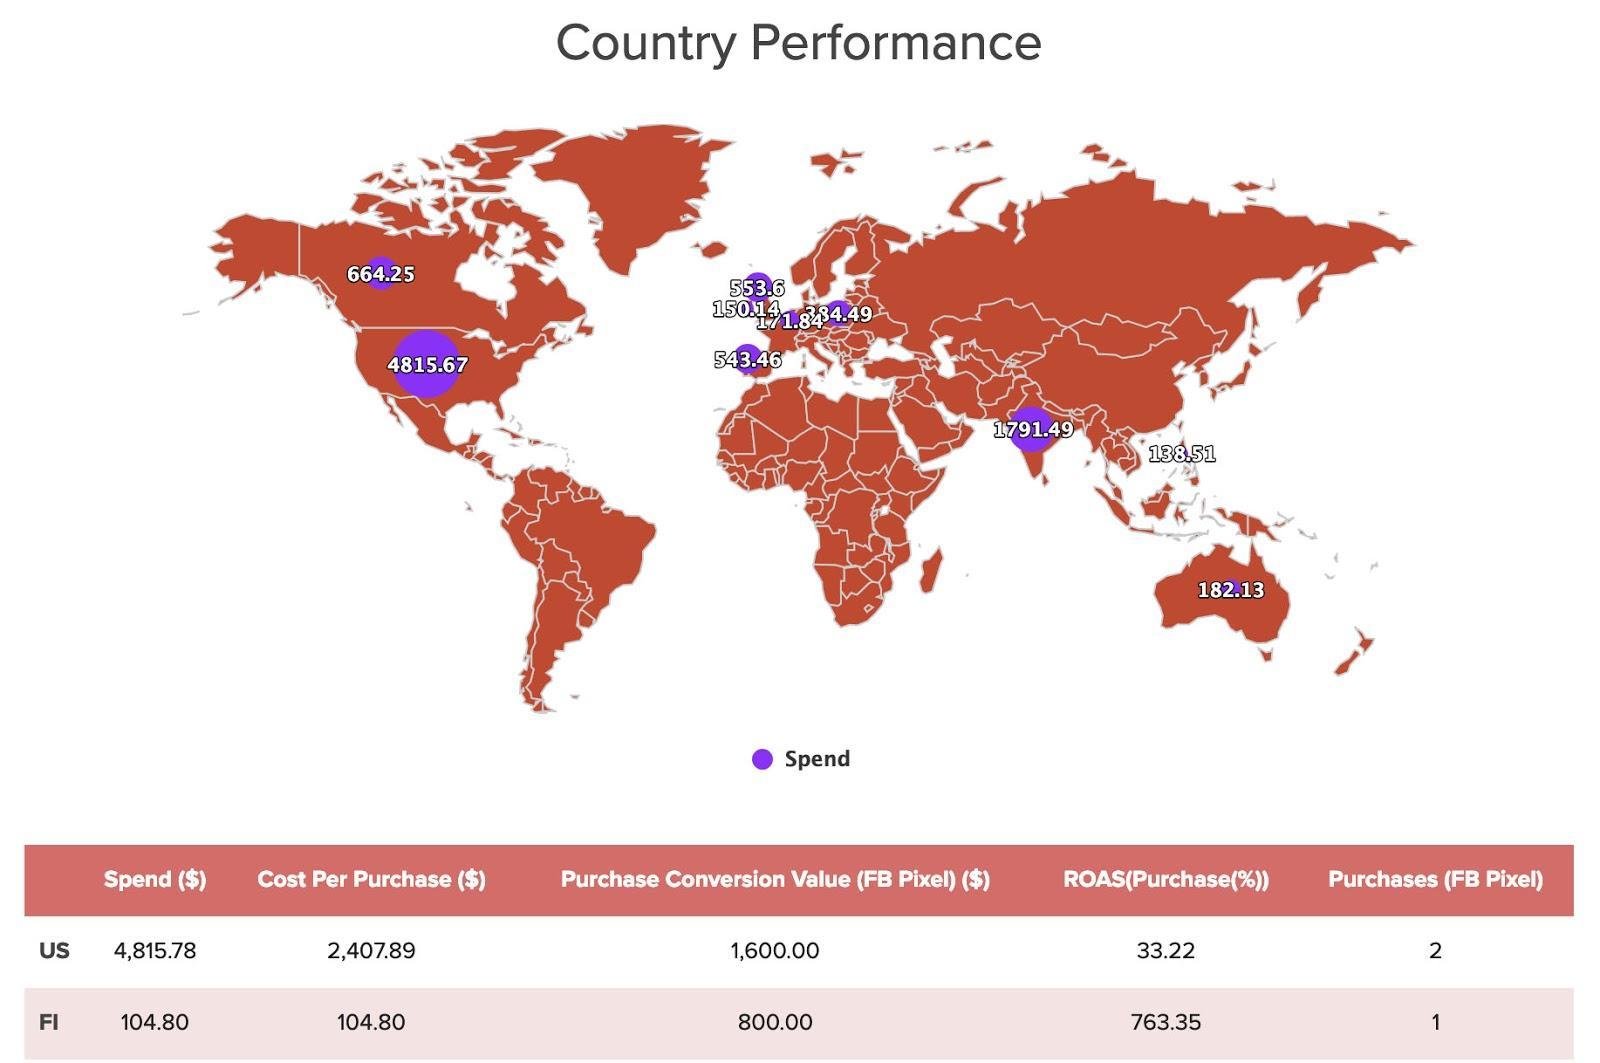
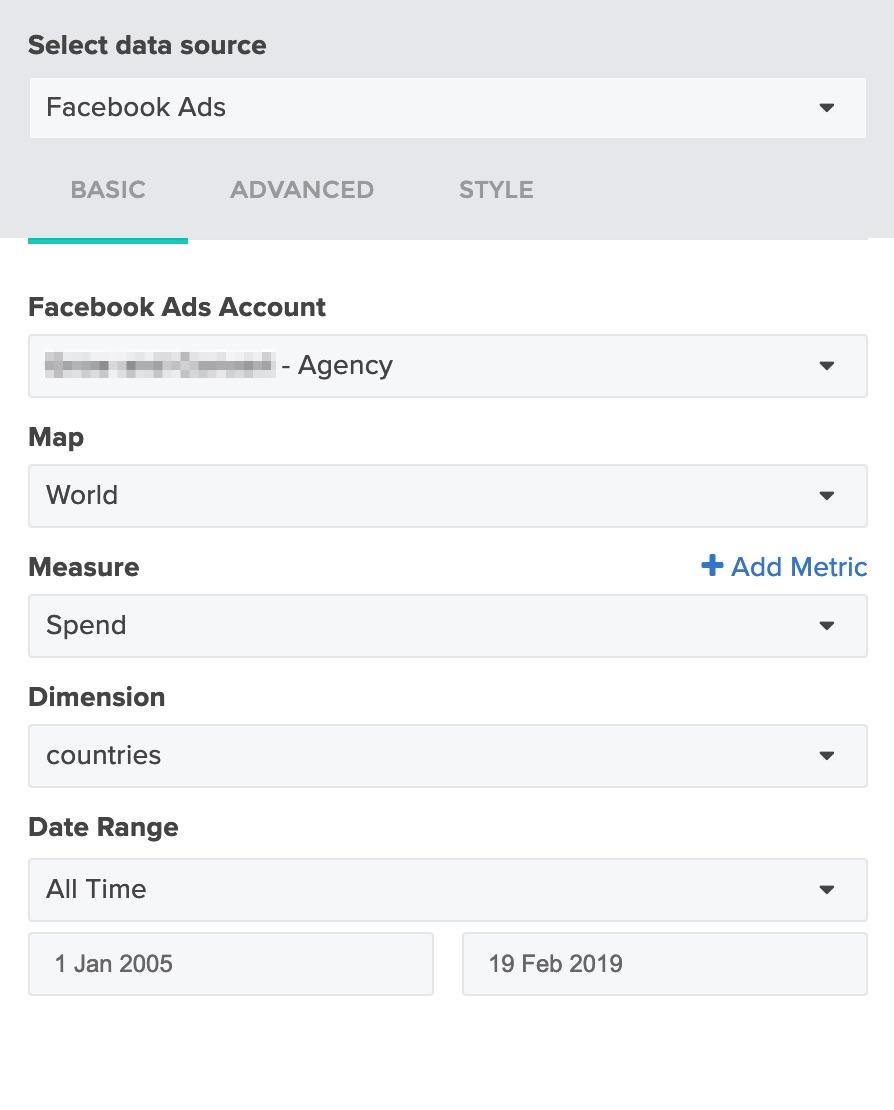
If your client runs campaigns internationally, this graphic is an excellent way to break down a category like spend, ROAS, or purchases in a visual way. Here’s what the settings look like for the map — the table is formatted as before.
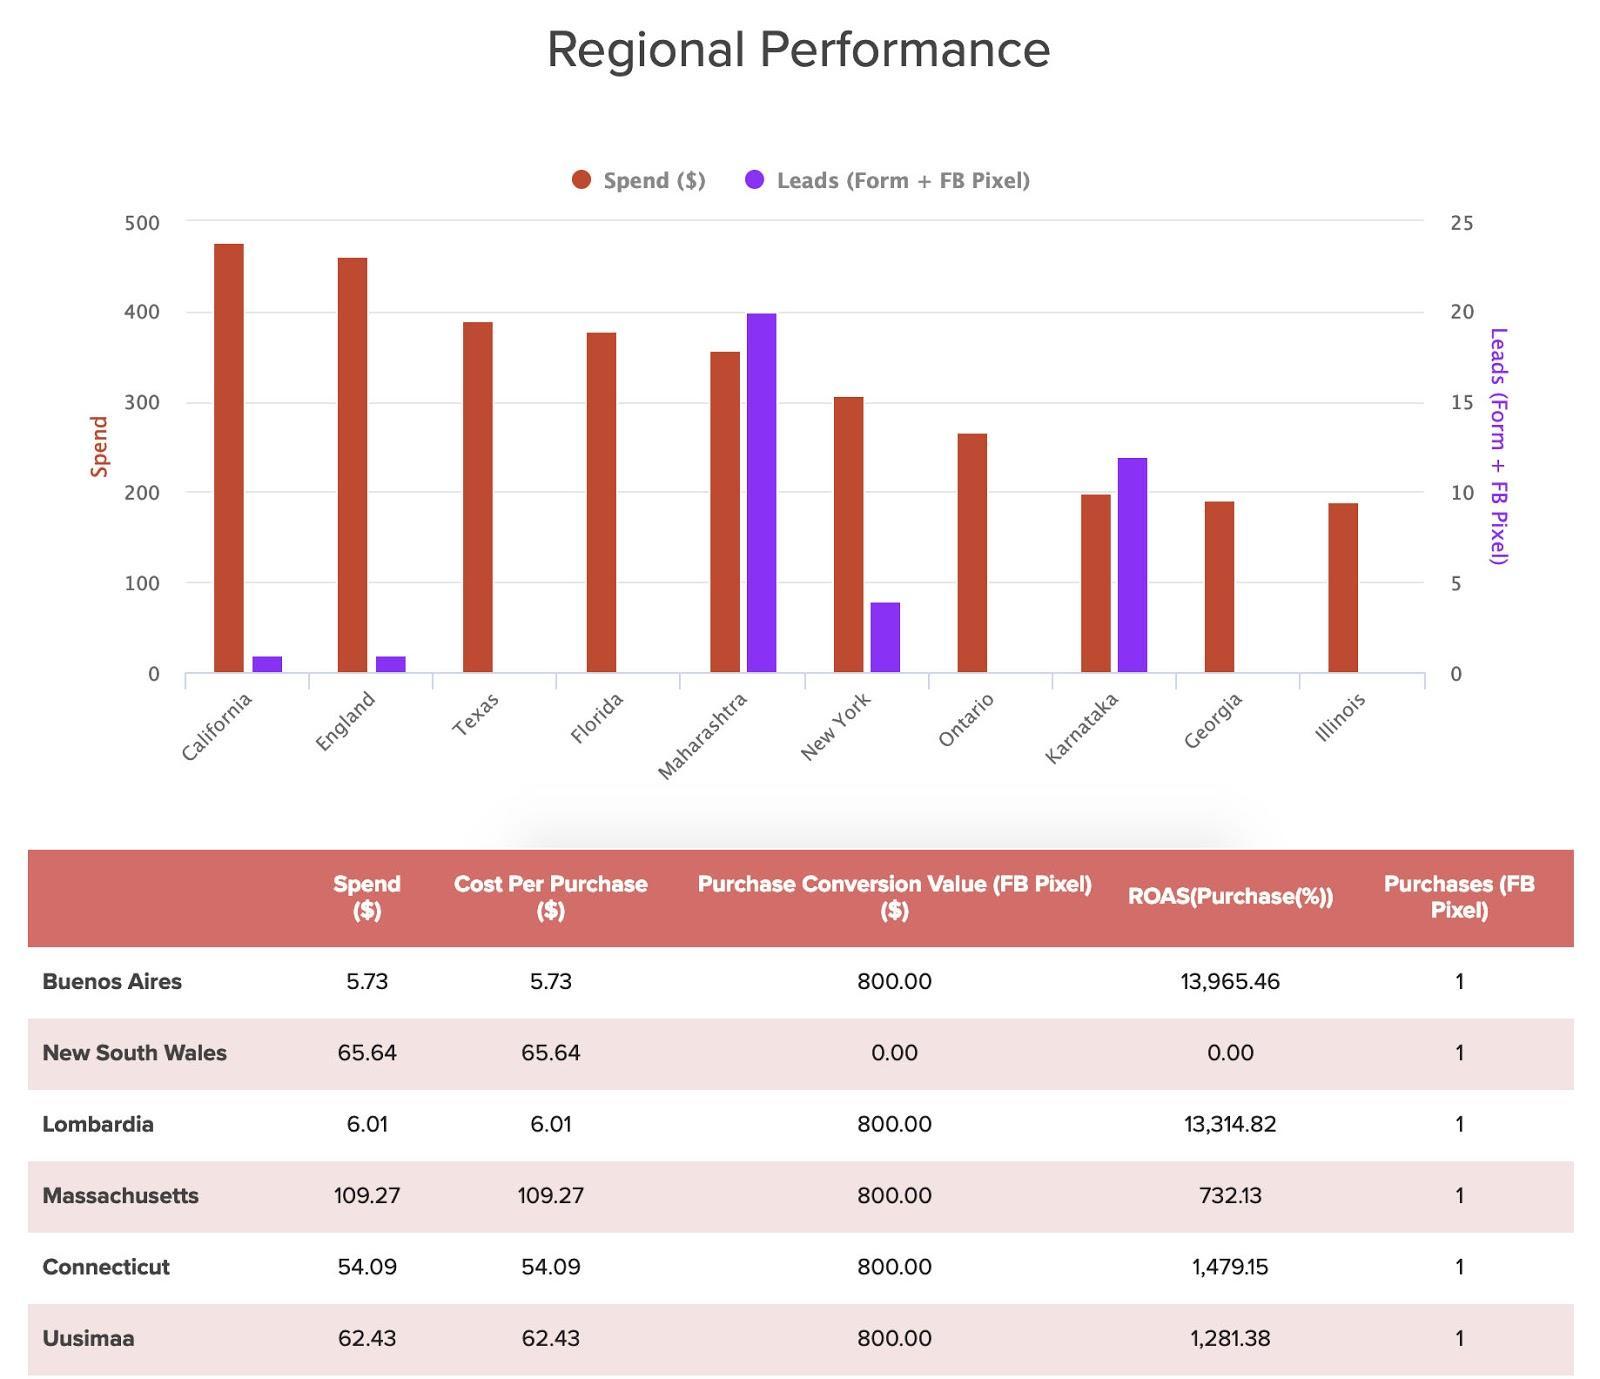
For the Regional Performance report, which areas you choose depends on where your client was running ads. The example below includes a mix of states in the U.S. plus a few international locations. It’s not easy to view on a map unless they’re close together, so this information is presented in a chart and table.
Here’s what the settings looked like for the chart:
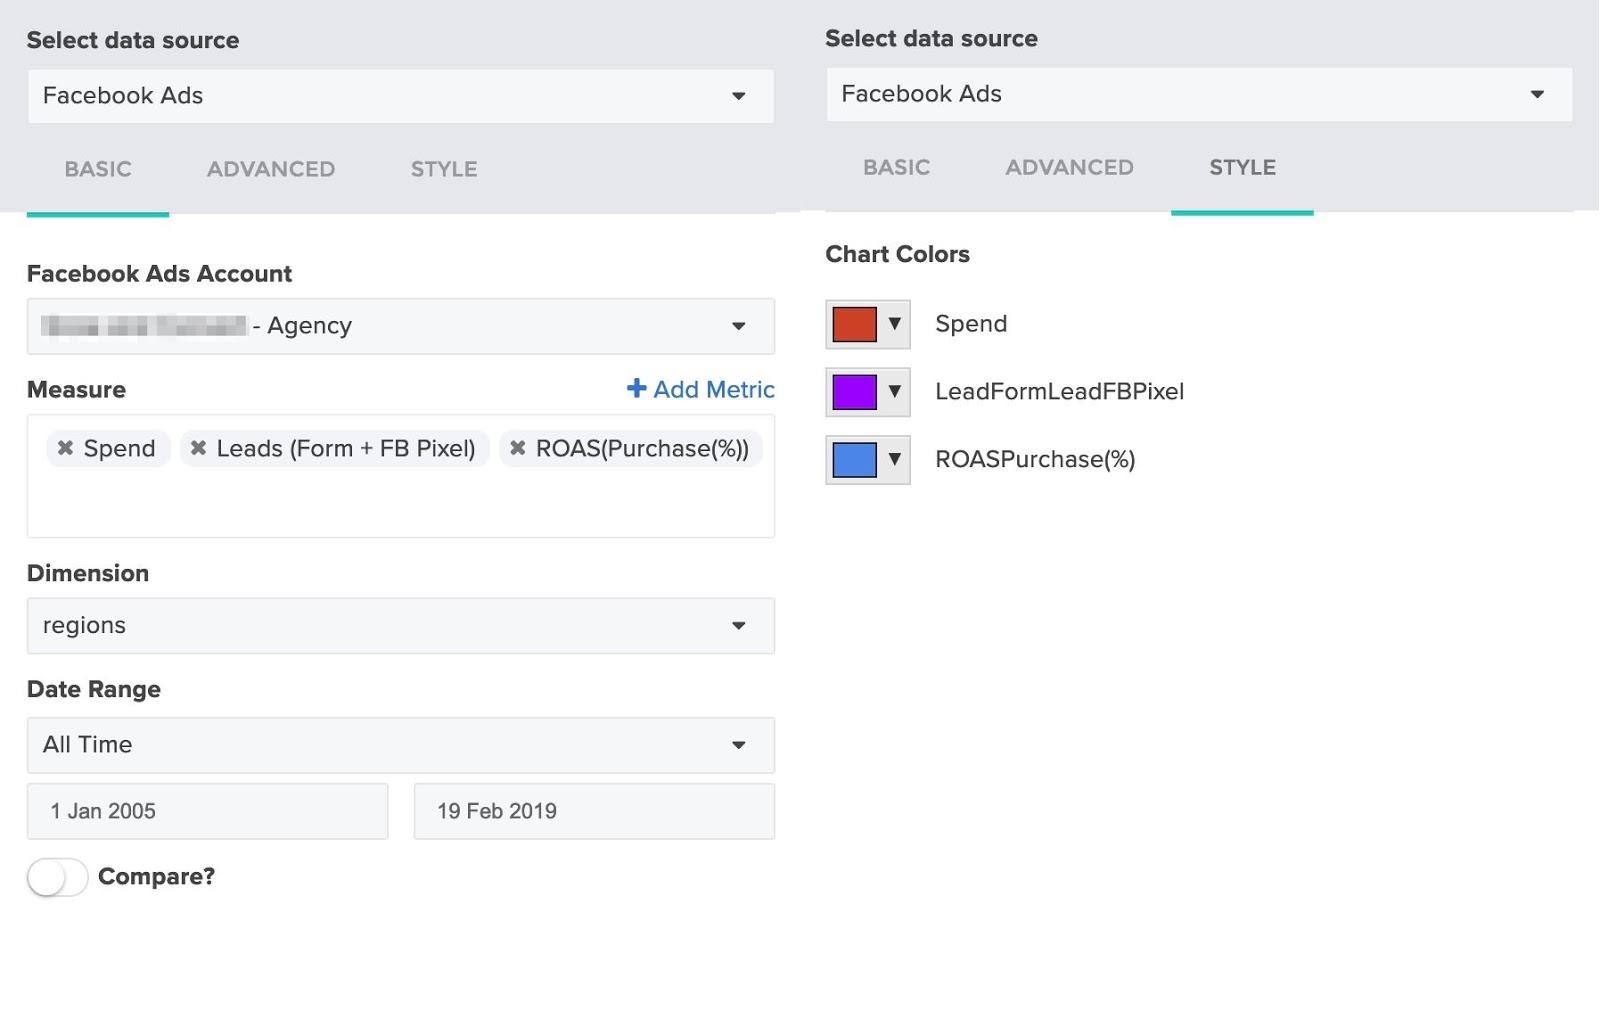
And here’s a look at some selections for pulling together the table, which can be sorted by your metric of choice.
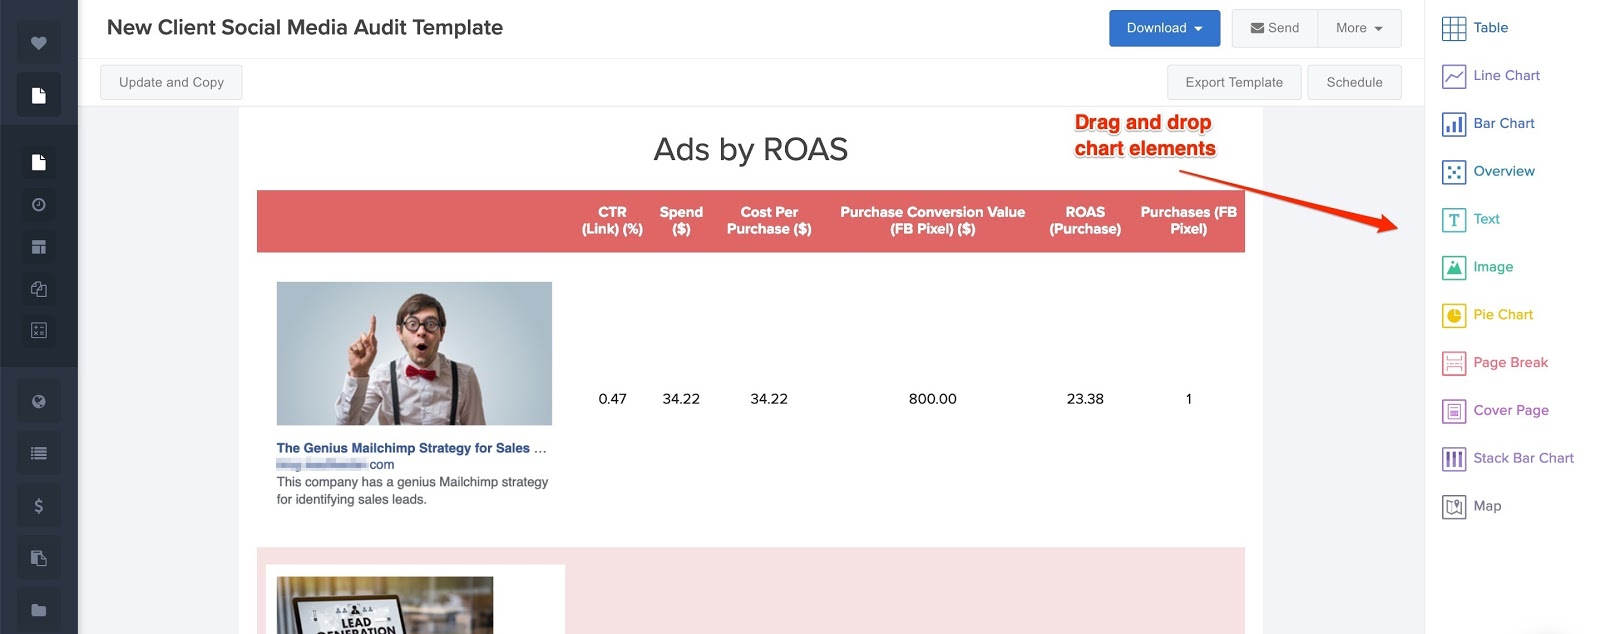
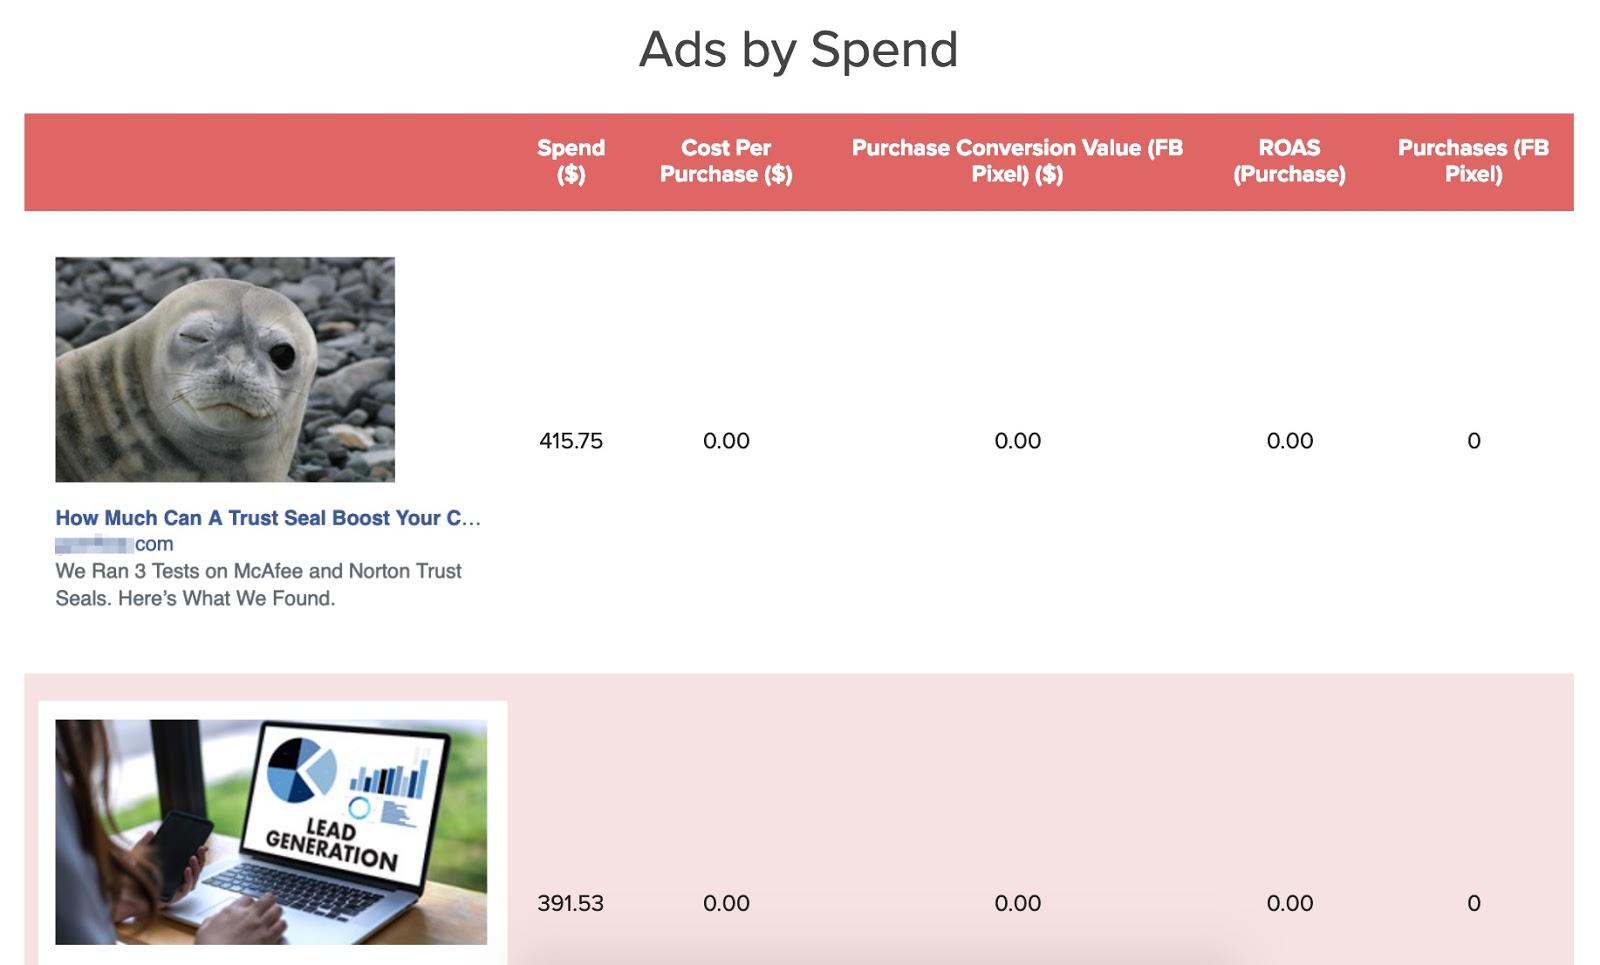
Ads by ROAS
This section is a client favorite. Here, you can break down performance ad by ad. Clients are able to see the text and image (or video) used along with how it performed. Many times, prospects and clients alike are surprised by which ads are performing better than others. Seeing it laid out in this format makes it easier for them to understand what’s happening and what they need to do next.
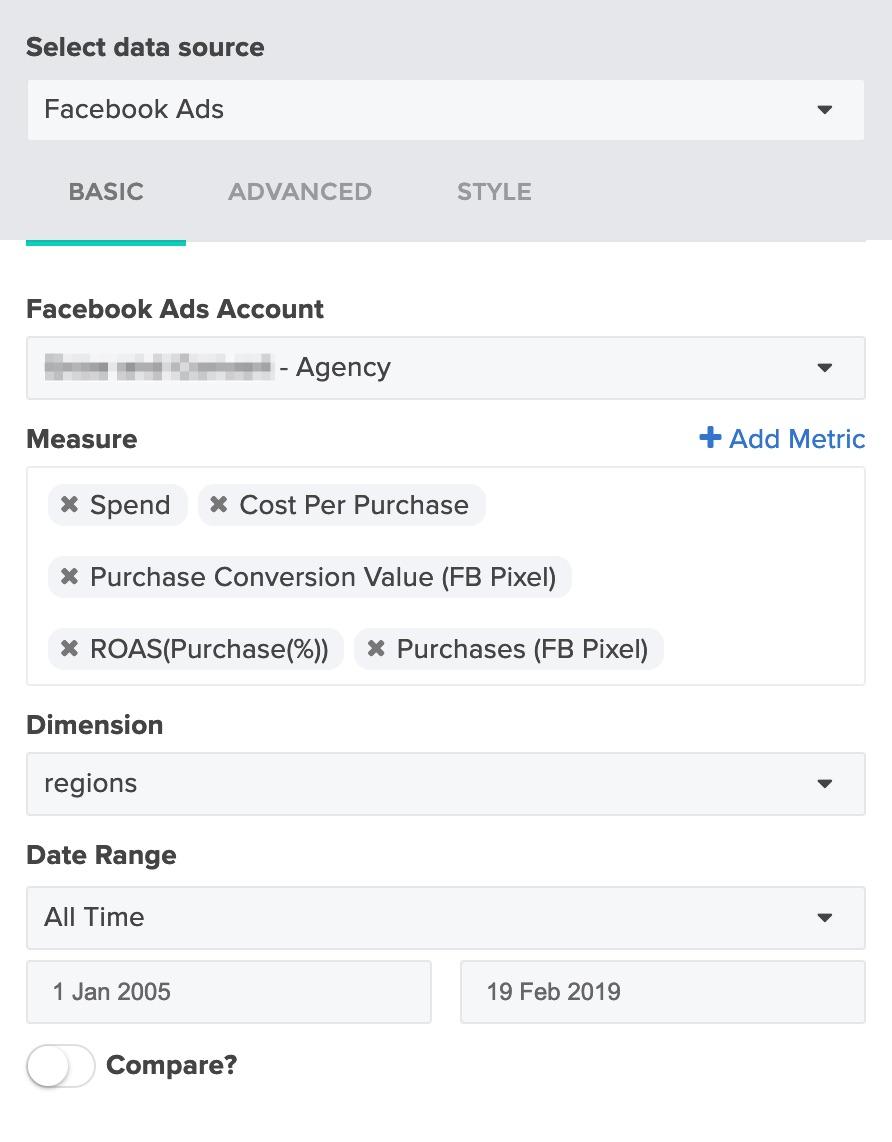
The most important thing to do here is to set your dimension to ‘Ads’ so that they will display properly.
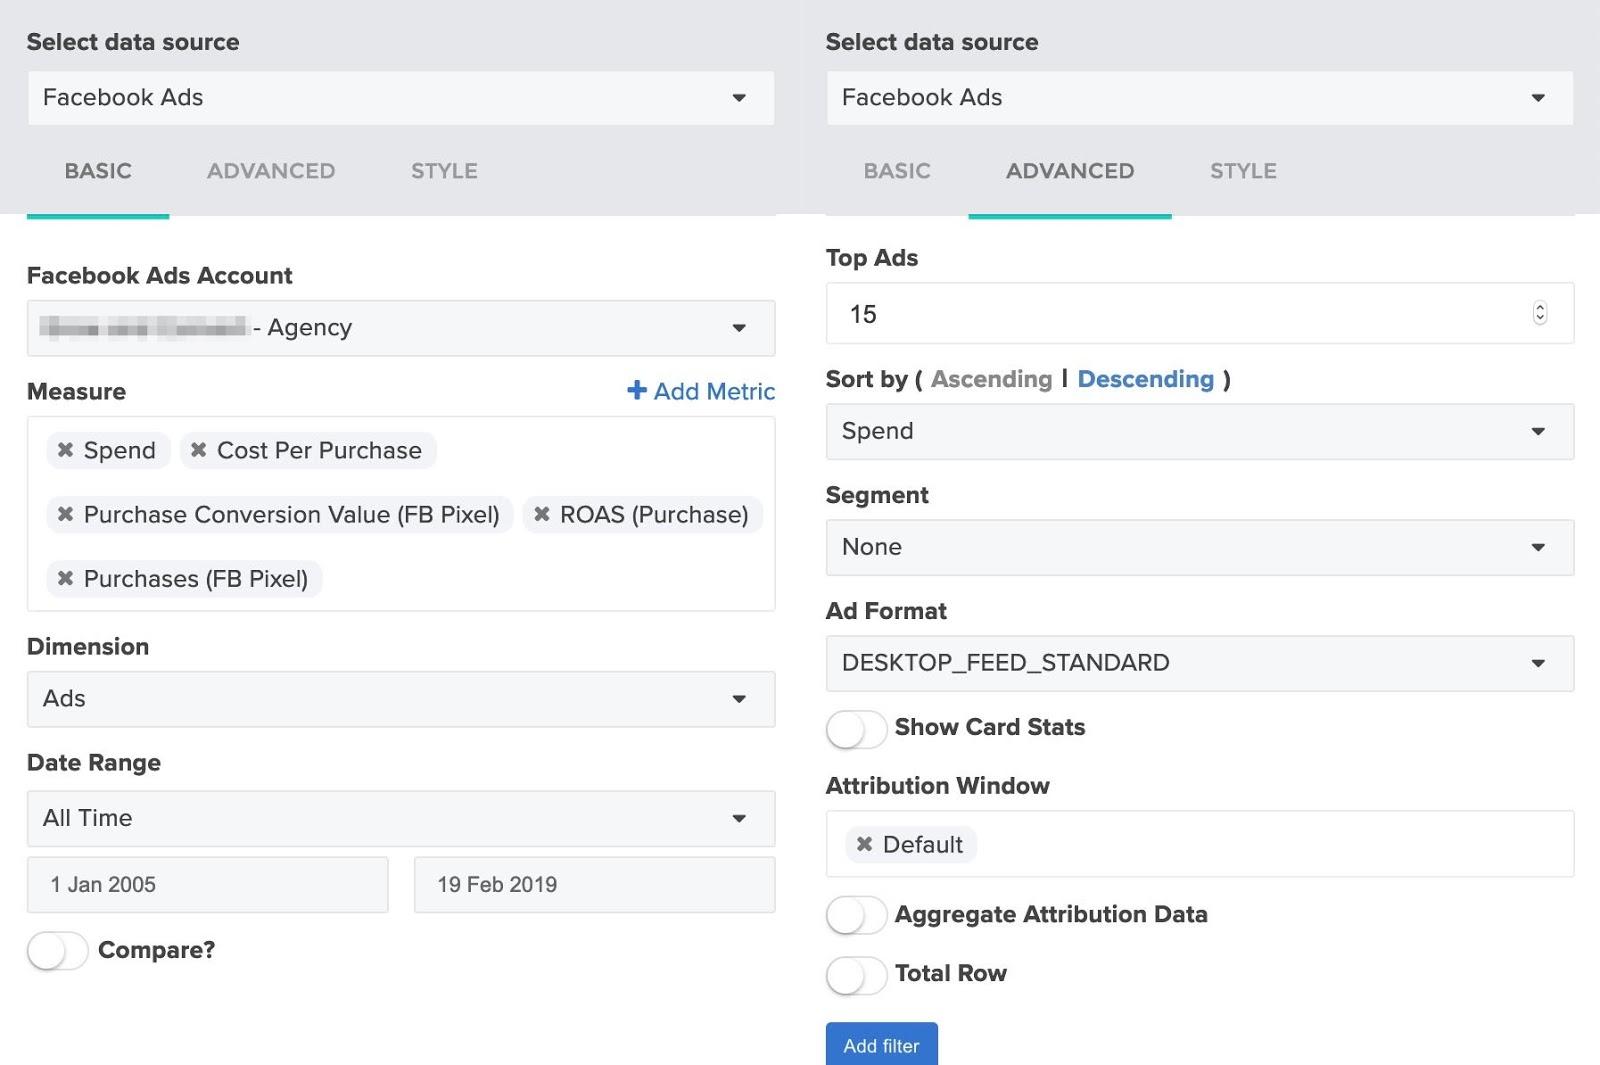
You can play with the “Measure” and “Ad Format” selections until you find something that works best for your clientele.
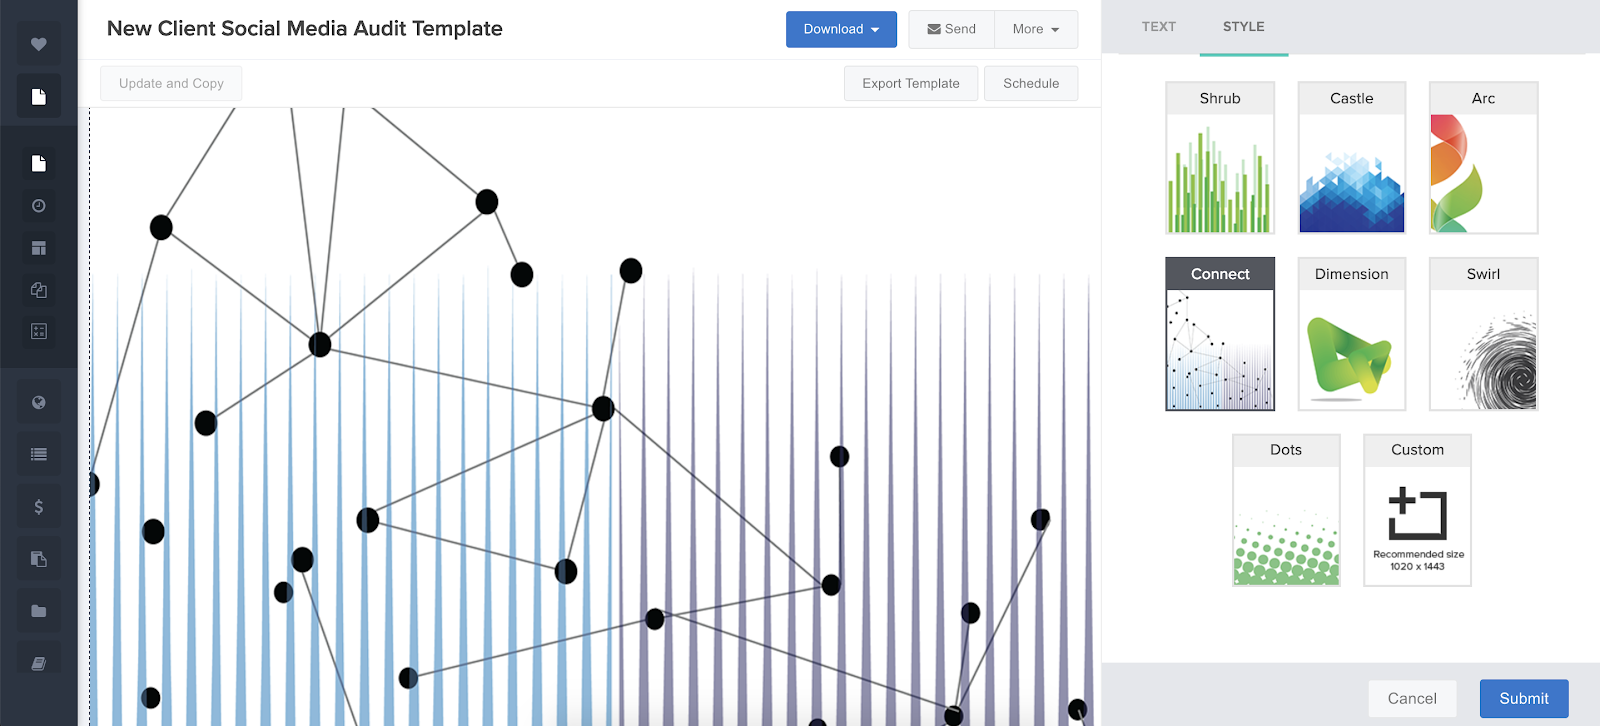
Choosing a Cover Page
There are a number of premade graphics you can use for a clean, modern appearance for the report’s cover page.
A Note on Campaigns & Filtering
While this article is primarily designed to help you pull together a comprehensive social media audit template, you can use the design for reporting on any social media campaign. ReportGarden comes with the option of including any cross-section of information relevant to your client. You can include all campaigns, one campaign, specific ad sets, or another preferred group.

To set your preferences, use the ‘filter’ button on the advanced settings tab. Next, filter data by campaign (scroll to select which campaign(s) you want to include or exclude), or use ‘campaign name’ to type in a keyword and grab any ads with that keyword included in the campaign name. This feature is especially popular when agencies look back at holiday campaigns such as Christmas promotions and Black Friday deals.
Use ReportGardens Comprehensive Social Media Audit Templates
Did our template and the associated options fulfill your needs? Regardless, we have more to add-on to our offerings. There are also dashboards to offer a quick overview. Presenting them to you in different options, such as multi-location performance, agency tracking, budget pricing, and many more of the dashboards.
Willing to try any of our templates right now? They are easy to access and even available on a free trial to help you explore the compatibility with your goals. Connect with us here to know more.
FAQs
- Can I conduct a social media audit on my own?
Conducting a social media audit on your own is possible and even recommended in case of a limited number of accounts and activities. Knowing your goals, journey, and activities well can offer deeper insights. However, established brands with high workloads might feel it challenging to perform without the help of tools.
- At what interval should the social media audit be performed?
The time interval for social media audit varies depending on the brand’s goal, size, activity and other factors. While the brand can decide it based on its strategy and goal, generally speaking, the ideal time is quarterly or semi-annually.
- What do 80 and 20 refer to in the 80/20 rule?
The 80/20 rule states the type of content to be posted by a brand. Here, 80 signifies the percentage quantity of educational, entertainment and problem-solving content, while 20 signifies the required amount of promotional content.
.png)


