
“The essence of a strategy is to choose what not to do.” – Prof. Michael Porter
Let’s look at how a smart targeting strategy and a willingness to test ideas helped one business in the corporate events industry make more money (and also helped us realize just how important location targeting is to ROI).
About five years ago, this company had a modest budget of $3,000 per month. This was considered a smaller budget for the nationwide campaign this company needed. So a plan was devised to research and target the primary cities across the U.S. that showed a demand for their services – six cities to start. Over time, the results grew, and this client amassed real revenue from PPC – so much so that they increased their PPC budget to what it is today – about $18,000 a month, and we now target more than 30 cities. But they wanted to expand its reach further on the Google Ads search network, so we decided to open up the location radius a little beyond the city. Results continued to be strong, so the experimented more. We eventually decided to target the entire states of all the cities we had campaigns in.
What happened next?
It wasn’t good. In fact, account impression share dipped from 78 percent to 69 percent in a four-month period. Also, leads dipped by 15 percent overall during that period.
Despite what we were seeing, we held tight to the strategy to collect more data, and analyze the results. After a couple more months, we were able to make a determination that the city-focused strategy was, in fact, the best strategy for this client in most cases. We did see instances where targeting the whole state led to more leads at a better cost per lead. This just goes to show there will always be outliers, and you don’t know until you test. But in most cases, we saw the city campaigns driving more leads at a lower cost per lead, on average.
For example, when targeting Florida as a whole, the results were 39 leads at a cost per lead of $155. When targeting specific cities, the business gained 53 leads at a cost per lead of $135…more leads at a lower cost per lead.
Although there was a decline in positive results during this test, we were satisfied. The willingness to test is especially important when you’ve been running the same campaigns for years (don’t default to a “this is how we’ve always done it” excuse if you don’t have to).
Examples like the above support metrics that find Geo-targeting doubles/ reduces the performance of all kinds of marketing methods, from email campaigns to paid search.
Much like how snorkeling is popular in Hawaii and sledding is in Alaska, you may find that your business flourishes in particular parts of the world. A research states that roughly 20 percent of the searches on Google are for local information and roughly 40 percent of mobile searches are after local info. Performance data in your Google Ads account can help you identify those geographic areas, so you can decide where to focus more of your advertising efforts and budget.
In this article we’ll walk through a few simple steps for setting up “default” Geo-targeting options, and then a couple of analyzing techniques that can expand and refine your Geo targeting reach to improve the performance of your ad campaigns.
Find the infographic on 10 Steps Google Ads Geo–Targeting Reports here.
I. How to create Google Ads Geographic Reports
A. Types of Google Ads Geographic Reports
There are two reports pertaining to geography in Google Ads, and it is important to understand the difference between the two. The reports look very similar, but they attribute data to geographies differently.
- The Geographic Report (Google Ads): The geographic report shows the performance of the locations you are targeting. If you are targeting people “in, searching for, and viewing pages about my targeted location” (as opposed to just people “in my targeted location”), you will only be able to view the performance of those people who are not actually within your Geo-targets through the geographies in which they have shown interest. You will not see the performance of their physical location. You can, however, add the location type column.
- The User Location Report (Google Ads): The user location report shows the performance of the actual geographies your searchers are physically in, regardless of whether that location is included within your Geo-targets or if they have seen ads because they’ve shown interest in a different geography.
B. What Is Google Ads Geographic Reporting?
The geographic reporting available in the Google Ads dimensions tab offers you a look at how your campaigns are performing in different geographic regions. For each Google Ads campaign, you can select the countries or regions and the languages for your ad. That campaign’s ads will appear only to users located in those areas and who have selected one of those languages as their preference.
By default, your report will show country/territory data, but for many accounts it’s important to see region, metro area, and city data in the report. For instance if you’re running a campaign that is set up to run nationally but targets different cities and Geo-regions such as a national chain or an aggregator, it’ll be critical to break out data at a geographic level to see how different regions are performing.
C. Setting Up Google Ads Geo-Targeting Reports
As you create an Google Ads ad campaign, you’re offered with some initial options for Geo-targeting. If you already have a campaign set up, you can go to the Campaign > Settings tab and access this same menu of options.
From there, you can either grab one of the high-level defaults that Google offers up or choose the select one or more other location targeting options available:
- Geo-targeting Bundles Tab – Bundles are a nice way to quickly grab related countries and roll them into one targeting option. The US and Canada bundle is particularly useful here for many North American advertisers. The downside to bundles is that they’re very imprecise. Be careful to explode the bundle to see what countries are in that bundle and that they make sense for our business.
- Geo-targeting Browse Tab – This is a bit like directory-style Geo-targeting, as you can drill down and see some specific state/town options. Again there’s a certain imprecision here for really granular Geo-targeting.
- Geo-targeting Search Tab – If you have a specific town in mind, this is exactly what it sounds like and will allow you to grab that town, state, etc. and target it. Again this can sometimes be a bit blunt for businesses that want real Geo-targeting control.
- Geo-targeting Exclude Tab – This is a nice feature if you’re looking to quickly drill down and create a “custom” Geo-targeting segment. For instance, if we wanted to target very close to all of Massachusetts and not certain areas, we could start at the state level and include some specific exclusions.
- Custom Geo-Targeting Tab – This is the most powerful of the Google Ads Geo-targeting tools. With this tool you can input an area code and a surrounding radius, create a custom “shape” which allows you to draw the area you want your ads displayed in on a map, or do a bulk upload of areas you want to advertise in.
So now you know how to get into the Geo-targeting interface and create a Geo-targeted campaign. But there are actually even more controls you can use to focus your campaigns on a specific geographical region.
D. Using Keywords for Geo-Targeting

To understand the next step in creating profitable Geo-segments within your paid search campaigns, we’ll use a specific example. Let’s imagine we have a company that sells tickets for various live events. While an event may be local, you might also be interested in attracting people located in other areas. If we want to sell tickets to a music show in Boston, we’ll want to make sure that our advertisement reaches searchers in California coming to Boston for a weekend and looking for “music tickets.” We also want people in the Boston area looking for “music tickets.”
We can accomplish this by setting up two separate campaigns:
- Geo-Targeted – This campaign is Geo-targeted to the specific region we’re interested in, but can use more aggressive terms like music tickets.
- Geo-targetifiers – Here we target the campaign to a broader region (possibly the US & Canada bundle) but force specific modifiers on the keywords (things like town names, zip codes, etc.)
If you’re consistently launching new local campaigns you’ll find that it’s very difficult to get good local keyword data. So a great way to get data is to launch with a “mashed-up” keyword list that includes a formula to combine modifiers and target keywords.
Using Geo modifiers will motivate users to take action since they are further down the purchasing funnel and have a good idea of what they are looking for. They are either ready to make a decision, need an answer to a specific question, or are looking to purchase. Keywords with Geo Modifiers will help you rank naturally in your area while obtaining the best return on investment in less time.
For example, often a great way to compile these lists is to identify Geo-modifiers you’ll want, such as: Boston, Boston MA and Boston Mass.
And append them to core terms: Music, Music show and Music concert.
To come up with a list like this:
- Boston Music
- Boston Music show
- Boston Music concert
- Boston MA Music
- Boston MA Music show
- Boston MA Music concert
- Boston Mass Music
- Boston Mass Music show
- Boston Mass Music concert
You can push these mashed-up keywords live and get real-time data about how searchers interact with your site by leveraging a keyword analytics tool.
E. Limiting Irrelevant Geo-Traffic
One common problem with the nationally targeted Geo-modifier approach is that not all locations have a unique town name.
If our concert weren’t in Boston but rather were located in Springfield, we’ll likely be subject to traffic from people looking for Springfield, Illinois music tickets. To prevent this we can set Illinois and any other state that has a Springfield as a negative.
If our business is heavily Geo-focused, we might consider adding negatives for every state name and abbreviation that we’re not advertising to in every single campaign. This lets us be proactive without having to identify every Springfield or other generic town name. By creating a quick list of the fifty states and their abbreviations, we can drop those 100 keywords into our campaigns at the campaign level to quickly create those negatives.
F. Processing Data Isn’t Just for Keywords
Much like processing search query data, to identify negative keywords and expanding your keyword list, is a great means of identifying profitable opportunities and areas where you’re wasting money, reviewing the geographic break-down of your paid search spend can give you some great insights.
Within your account you can get a really nice breakdown of Geo-specific data by looking at the campaign level and then drilling down to the dimensions tab, where you can take a look at performance broken down by:
- Region
- Metro Area
- City
You can then export this data and identify areas you want to exclude, and in many cases gain insights into which of your Geo-campaigns are and aren’t working for you.
While you certainly have a number of tools at your disposal for Geo-targeting your paid search campaigns, sometimes you’ll find that all your hard and careful work is basically ignored by the platform. Google often takes liberties with Geo-targeted campaigns, such as:
- Showing someone outside of your specified Geo-targeted range a Geo-modified ad
- Showing someone your ad who searched for “Boston chiropractor” from New Hampsire and then “music concert”, when the keyword you specified was Boston Music concert or the Geo-location you specified (basically the idea here is that they’ll use a searcher’s previous searches within a session to “guess” at Geo-intent)
All you need to do is to keep a close eye on your campaigns, monitor performance at multiple levels, and make use of the geographic dimensions report to identify areas for improvement. Because the reality is the ability to serve someone a specific ad in a specific location at the exact moment they’re searching for a Geo-specific location is a hugely powerful advertising opportunity: make sure you make the most of it!
G. Location Targeting & Advanced Location Targeting on the Google Ads Search Network
The 3 types of traffic that we might get when targeting anyone searching for a gym in Auburn, MA are:
- People who are actually searching for the term “gym” in Auburn, MA – targeted based on the keywords you included as well as the IP of the searcher (i.e., how you envisioned this to work).
- People who search for “Auburn gym,” by default, may be targeted by your Geo campaign because they’ve specified interest in Auburn gyms. But what if they pick the wrong Auburn? If there’s one thing broad match has taught us it’s not to trust Google to effectively match your keywords with relevant search queries without some hand holding.
- When determining which ads to show on a Google search result page, the Google Ads system considers the user’s current search term as well as some of the user’s previous searches during the same search session. If the system detects a relationship, it’ll show ads related to these other terms, too.

But they have changed this and offered more control over your ads’ targeting, breaking out physical location targeting and location by interest targeting. In typical Google fashion, however, this control is buried behind “advanced” targeting options:
- People in, searching for, or viewing pages about my targeted location (recommended) – This setting does exactly what it says it will do. It will send clicks from people inside of your targeted location(s) – this is good. But it will also send clicks from people “search for” your targeted location(s). Google will take liberties with your keywords and if someone uses a location modifier (city, state, etc.) with your keyword, your ad will show. And if you are running Display ads, if someone views a web-page with content based on your targeted location, your Display ad will show.
- People in my targeted location – This setting is the most specific, and in my experience the preferred option. This tells Google that you only want clicks from people inside your Geo-targeting parameters.
- People searching for or viewing pages about my targeted location – I consider this the wild card setting. It takes the loose matching options from Google and isolates them.
Why would Google recommend the setting that could send clicks from just about anywhere? At the core, this setting stands to send the most clicks ($$$) to your website. It can be argued that the traffic outside of your targeted location is just as qualified based on the search query or website viewed. But in reality, it isn’t appropriate for all advertisers. Most local businesses have no use for traffic outside of their targeted locations and any clicks that come in just result in wasted spend. When does the recommended setting make sense?
For a florist in Denver, Colorado that delivers flowers, for example, it would make sense to use the default setting so that their keyword “flower delivery” would match to anyone searching for “Denver flower delivery.” Another example would be someone working in real estate who wants to capitalize on searches for individuals or businesses looking to move into their targeted location.
While there are some scenarios where it makes sense to use Google’s default Geo-targeting setting, there is a better way. As with all things in PPC, the best option is isolate variables and test. Before we test, we should understand any potential damage done by using the default setting. In Google Ads, run a geographic report (Dimensions > Geographic):
Look to see how many clicks you’re receiving outside of your targeted location(s). Is it expensive? Is it converting? Good or bad click-through rate? Use this data to decide if you should simply limit your Geo-targeting to “people in” your targeted location(s) or if you should proceed to a testing plan to try and optimize your traffic.
To test, create a combination of campaigns that employ the various Geo-targeting options:
- Root Campaign: People in your targeted location.
- Test Campaign A: People searching for or viewing pages about your targeted location (this is the wild card setting that excludes people in your targeted location).
- Test Campaign B: Go old school and create a campaign that targets all of the U.S. (or whatever country you’re targeting) but leverages Geo-modified keywords for your targeted location.
II. How To Generate Google Ads Geographic Reports
Download your Google Ads Geographic report
In order to do analyze your Geo-targeting, you will have to download an Google Ads Geographic Report from the “Dimension” tab inside the Google Ads web interface.
- In your Google Ads account, choose Reporting, then Reports from the drop-down menu.
- At the top, choose Create a New Report.
- Under Report Type, choose Geographic Performance.
- Under Settings,
- Set Level of Detail to Account
- The View (Unit of Time) setting is fixed to Daily.
- Choose a Date Range that gives you sufficient data (I’d recommend to select a couple of months of data, maybe even more)
- Under Advanced Settings, click Add or Remove Columns, then check choose the following columns:
- Under Attributes you can select just Country/Territory, unless you’re doing local ads.
- Under Performance Statistics you can choose Impressions, Clicks and Cost.
- Under Conversion Columns you can choose Conversions (1-per-click), or if you are tracking your sales and sign ups separately, then choose the Sales Conv and Sign-up Conv fields instead.
We now have the raw Geographic Performance data saved on our computer.
III. Analyzing Google Ads Geographic Reports
A. Analyzing Your Google Ads Geographic Reports Using Excel
Now open the saved CSV file in either Excel. Note that Google Ads report are called CSV (as in COMMA Separated Values), but are actually TAB separated. So make sure you choose Tab as the delimiter when importing.
- At this point you may want to Save the report in your spreadsheets native format, .XSL for Excel.
- Delete the top 3 rows (report, account and date range) and the bottom row (totals) from the sheet.
Now you can see the Geographic Performance Report that gives us performance data per country per day, which is not very useful. To get a useful summary per country, we need to aggregate the data by country using a Pivot Table. Here’s how to do that:
- Select the entire sheet by hitting Ctrl-A.
- In Excel, choose Data / Pivot Table Report.
- As the destination of the pivot table, choose New Sheet.
- For the Layout of the pivot table, drag the Country field to the Row box and drag the Impressions, Clicks, Costs and Conversions fields to the Data box.
- Make sure the Data box now says “Sum of …” for all fields. Double click each field to change it if necessary.
- Leave the Column box empty.
After generating, the pivot table is created. Since we have selected multiple data fields and by default these appear vertically arranged. However, we want to be able to sort on each of these fields, so we prefer to have them as separate columns. To make that happen, just drag the header of the Data column one cell to the right and drop it on the cell that says Total.
And finally, we have an aggregated performance report by Country, with nice totals for Impressions, Clicks, Costs, Number of Sales (and in my case, Number of Sign Ups).
Analyzing the data from Excel
Now, let’s see where we are making money and, more importantly, where we are losing money.
- First sort the table on the Cost column. This may already provide some eye-openers. For instance, which place is ranking at what position based on the money spent in return to the clicks recieved.
- Now let’s create a column that is a rough estimate of our earnings in each country. Just call it Revenue. In the first data cell of that column, use a simple formula ito fill it with the Number of Sales times your average sales value. Copy that formula down the entire column.
- Create a 2nd new column called “Margin” and use another formula to fill it with the value of the Revenue column minus the Cost value. Again, copy it down for all cells in that column. This Margin column is essential, as it shows us whether we are making money or losing money.
- To make the negative values stand out more, you can use Conditional Formatting (Formats menu) to set the background of values < 0 to red.
Now take a close look at the countries with a red Margin box, especially the ones near the top and the ones where you are loosing a lot of money. Try sorting on this new Margin column to quickly find the biggest money wasters.
B. Analyzing Your Google Ads Geographic Reports Using ReportGarden
Where Excel shines at data preparation and data visualization, it takes quite a long time to prepare it and also it needs to be sent manually. This problem can be solved by a reporting tool like ReportGarden. ReportGarden is a PPC & Google Ads Reporting Tool which lets you automate your work and also bubbles up important insights about your campaign. You can try the tool for free!
Here is an easy and quick guide to create Google Ads Geographic Reports using ReportGarden.
a
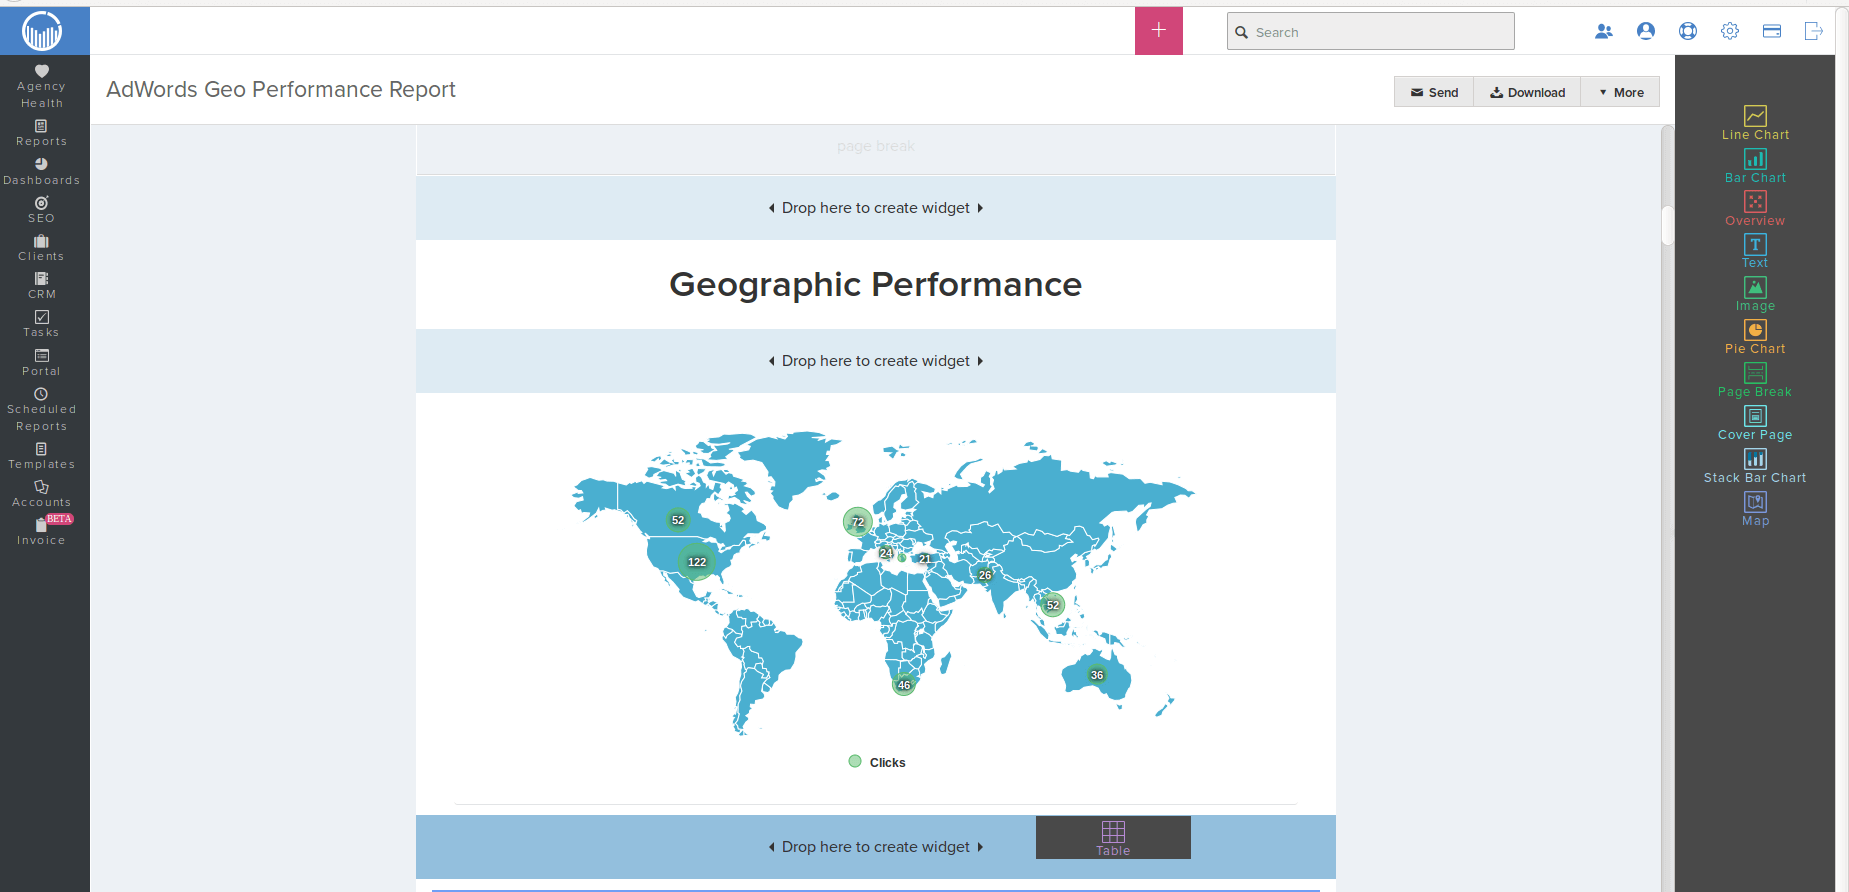
This is how a typical Geographic Performance in ReportGarden tool would like.
In order to access the various Custom Google Ads Reports available in ReportGarden, you need to Sign-up with ReportGarden and create your account. And also link your Google Ads account with this account.
1. Select New Report option available in the Reports option on the left side of the screen.
2. Name your report and select a template that will generate your report in the required format. For example, for this Geo performance report we can select Google Ads New Template from the options available.Select your Google Ads account from the drop-down menu of the Google Ads Account and also the time period that you would like to analyze the campaign for.
After submitting the details your screen would look like this.

Each page of the report can be modified according to the interest of the client with various text formats and custom colors with the edit option on the respective page.
3. This cover page is followed by various performance reports that are all included in the Google Ads reports.
4. Since we are looking for a detailed Geo Performance report, we can delete all the other performance reports except the Geographic Performance sheet. Whenever they are needed they can be added back into the report easily with the widgets available.

The geographic performance map shown can as well be modified easily to include only specific countries as per the requirement of the agency. Also the map can show different measure like the clicks, impressions, CTR% or conversions based on what is to be displayed on the map.
You can also Add Filter to the measures by selecting the required one from the options available according to your campaign, like Network, Campaign, Ad, etc and also set the minimum criteria to be satisfied to be able to identify that region as a potential market place.
5. Check the different widgets available on the right side of the page and drag the Table option and place it beneath the map.
6. You can now edit the table attributes where-in you can change the Measures, Dimensions, Date range. Also in the advanced settings you can change the number of rows that you would like to include, sort in ascending/ descending order based on any measure available. For better and appropriate results you can as well segment the table including results from only the Device Type or Conversion Type or Network or the other options available.

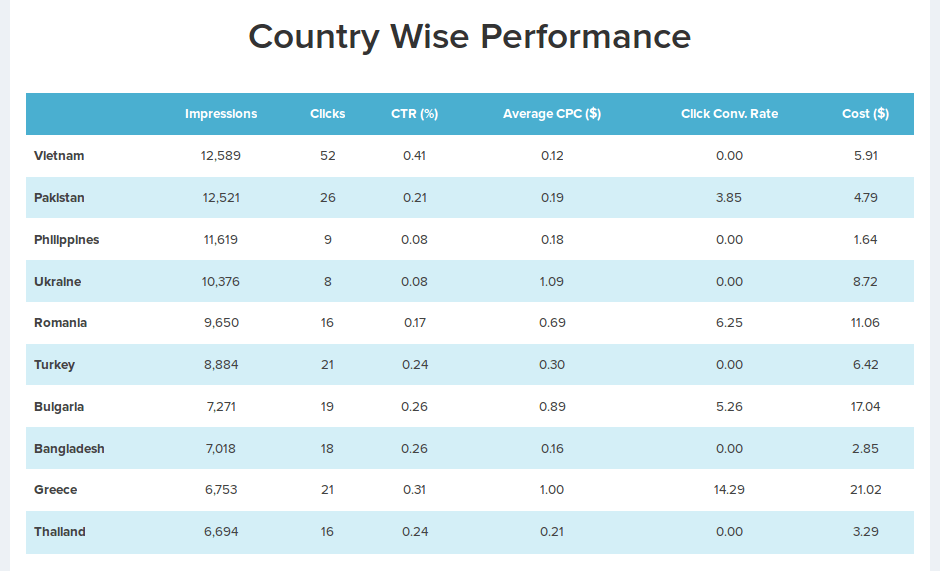
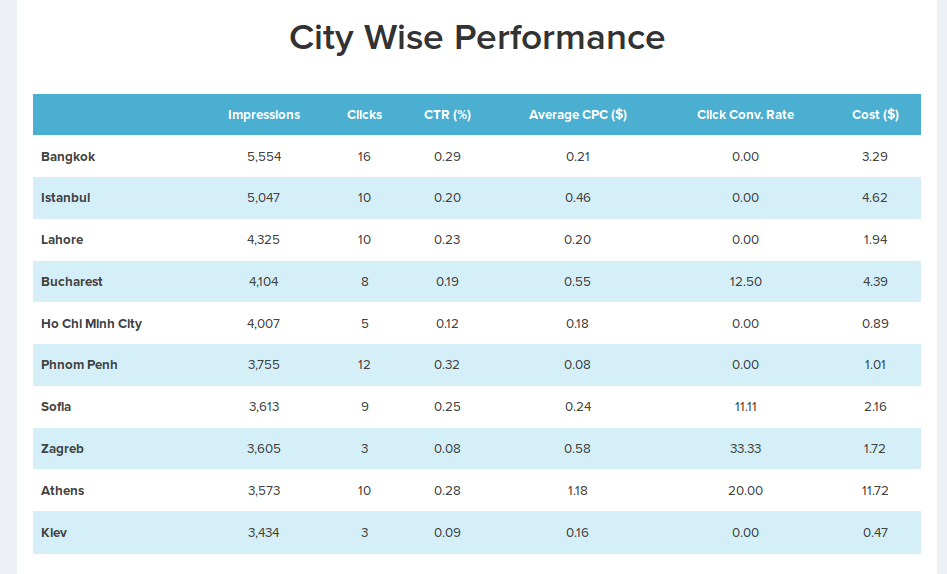
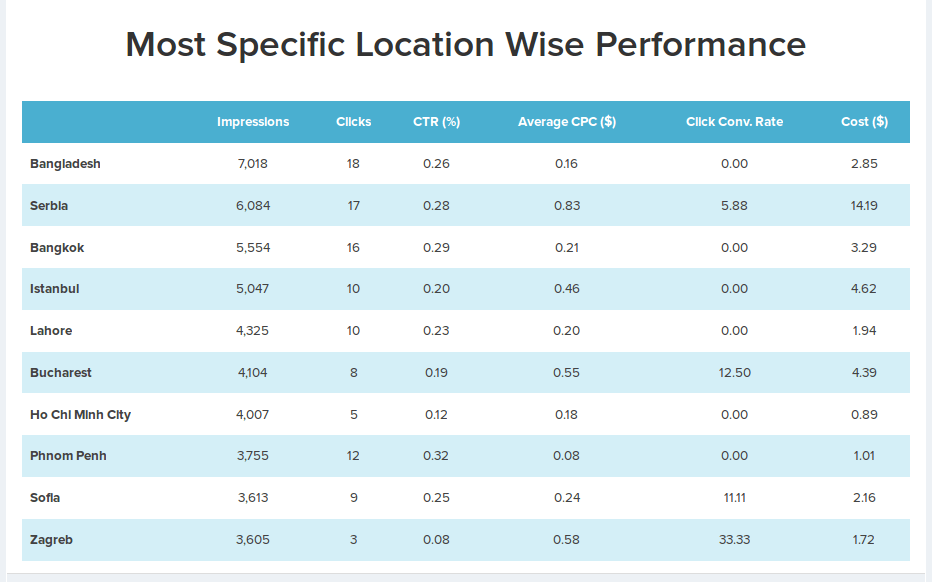
In this example, I will choose Impressions, Clicks, CTR%, Average CPC, Click Conversion Rate and Cost as the measures to understand my overall ad campaign performance better.
7. In Dimensions there can a separate table created for each of these with the same measures to understand the campaigns performance better: Countries (Geographic) , Regions (Geographic), Metro area (Geographic), Cities (Geographic) and Most Specific Location (Geographic).

You can now play with the visualization tools available by changing every attribute in the performance map and the tables by adding filters to each and understand the effect of each of the measure on the overall performance of the ad campaigns run across different regions of the world.
C. Using The Data Analysis To Your Advantage
The simplest way to use the data is by pivoting the geographic report to see how the areas within your Geo-targets are performing. It’s good to do this on a granular level. For instance, if you are targeting states or countries, it’s good to look at smaller groups of geographies to see if there are any performance sinkholes, or even the opposite. I usually prefer to look at performance by city or metro.
There are a few different ways to use this data:
- Exclude areas that are spending without generating a positive ROAS (Return On Advertising Spending).
- Update geographic bid modifiers in order to improve cost efficiency and volume based upon each geography’s performance.
- Consider breaking out campaigns for geographies that are considered to be outliers. In that they either generate a lot of volume but are not cost-efficient or they are significantly more cost-efficient than the campaign average. Breaking out outliers provides you with the ability to utilize all the campaign settings in order to optimize each Geo to its potential. Moreover, breaking out geos can help to ensure that you aren’t paying too much in geographies that don’t warrant it. It can also help ensure that budgets are spent most efficiently.
D. Value of Google Google Ads Geographic reports
The geographic reporting options in Google Ads can be valuable when used by:
- Well-ordered accounts that have tackled the fundamentals (keyword targeting, campaign organization, and strong landing pages) and are looking to squeeze more efficiency from their campaigns.
- Accounts with a strong Geo-focus that have products or offerings that are Geo-specific (i.e., physical locations, locally focused content, etc.).
- Accounts where a single geographic segmentation happens to be driving a lot of volume at an inefficient cost per conversion.
You shouldn’t prioritize geographic data analysis above executing on the fundamentals but it can be a very useful report, particularly for Geo-focused accounts and more mature accounts looking for additional optimizations that will help them move the needle.
Learn more about how you can automate your Google Ads Client Reporting!
.png)


