Imagine you’re managing a campaign for a product that sends videos over optical fiber. Would you think to set “Justin Bieber” as a negative keyword?
I know I wouldn’t!
But as it turns out, this is one of the best moves that has been made by Rolands, who manages this campaign. Rolands oversees paid search for AD Net, a Taiwanese manufacturer of Formosa cables. A few weeks ago, as he was mining his search query data, he noticed that his ads were showing to searchers looking for videos of Justin Bieber—not exactly his target audience!
He quickly realized that Google considered “Bieber” to be a misspelling of “fiber,” which is one of the most prominent keywords in his account. There were so many variations of Bieber queries that Rolands found himself “cleaning Bieber’s for the next few weeks.”
If you’re lucky, your keywords aren’t matching to one of the most commonly searched pop singers on Google. That said, we should all be utilizing negatives to help ensure our ads are only being shown to qualified searchers. Google can get pretty aggressive with its broad matching, and you don’t want to end up paying for a Bieber’s clicks.
Google Ads is all about getting the best results. Organizing your account properly with the right keywords targeted to the right geographic area and audience is very important.
Find the infographic on the step-by-step procedure to create Google Ads Search Query Reports here.

The goal is to raise click through rates (CTR), lower cost per click (CPC), and decrease cost per acquisition (CPA), all while getting enough impressions, clicks, and conversions to stay in business. One way to do this is to weed out terms that aren’t performing because nobody wants to bid on a phrase that isn’t converting, even if it does have a high CTR and low CPC. But knowing which terms to bid on can be extremely tricky. Businesses bid on a variety of exact, phrase, and broad keyword matches, but you don’t always know for sure the exact phrases people are searching for and which ones are converting, especially when you’re bidding on broad match terms.
The problem with broad match terms is that your ads end up showing for a large number of search phrases that have less and less of a connection to the keyword you’re bidding on. This means your Quality Score will go down, your cost per click will go up, your conversion rate will go down, and your CPA will go up as well. For example, when you bid on “women’s sports shoes” as a broad match, your ad will be served for related terms that include synonyms like “ladies sports shoes” and “shoes for women”. This helps to get more impressions for your ads, but it’s not good if you aren’t selling regular shoes for women and only want your ads to be shown to women who want sports shoes.
So what can you do about this, and how can you use the search terms report to find negative keyword opportunities in order to optimize your campaigns?
Search Terms are an Google Ads advertiser’s best friend. Search term reports (or STRs) show you what users were actually searching for when your ad was triggered. They give you insight into how your customers search. They can even generate ideas for new keywords you may have missed and also allow you to exclude irrelevant keywords. They keep your account focused and ensure your ad dollars are going to the most qualified people. Conducting STRs can be really fun by the way. You would be surprised what other people actually search for in Google. Search queries are certainly an extremely important piece of online advertising as they show you not only the keywords that you’re bidding on, but the actual queries that are driving traffic to your site.
Your Client expects search terms performance report
This video talks about easy keyword research strategies in general. Hence, to be able to understand the importance of the search queries, this blog post will talk about the power of search term reports in particular for keywords research and expansion.

That said, an important thing to note about the search term report is that you can now find very similar data in the default keyword tab reports, and that from those views you can designate negatives right from the Google Ads interface.
Google Ads can generate a report with all search terms that were used by multiple people and received clicks in the past 30 days. All other search terms, along with those from the last day, will be summed up in the “Other search terms” row.
To generate your Google Ads search terms report:
- Click the Campaigns tab.
- Click the Keywords tab.
- Click the Details button.
- Select All from the drop-down.
- Click the download button to export the data.
The value of the search term report is really in pulling larger volumes of search query data into Excel to manipulate the data there. You can get similar data from the keywords tab, but often getting a mass of data for this purpose is much quicker and easier within the search term report.
As you can see from the options around downloading a report, the options from within the dimensions tab allow you to create a really robust report where you can:
- Customize the columns/data you’re shown in the report.
- Layer on additional segments like conversion, time, or network data.
- Schedule the reports to run every week or month so you can have the same report queued up for use in your normal optimization process.
Once you’ve exported this data, what you do with it on an ongoing basis is what this blog talks about. This blog is divided into 3 parts :
I. Value of Google Ads Search Terms reports.
II. Preparing the data for analysis of the Google Ads Search Term Reports.
III. Acting on the insights generated for the Google Ads Search Term Reports.
I. The Value of Google Ads Search Terms Reports
If you are bidding on broad match keywords and ignoring your search queries, you are definitely wasting money, by not managing your negative keywords, missing out on profitable long-tail keyword opportunities, and possibly missing new emerging search trends in your market.
A. All keywords are not search queries
Keywords are not search queries, although search queries can be keywords. Keywords are assumptions about the words we think our customer will use when using a search engine, while search queries are the reality. If you are only using exact match keywords in your PPC campaigns, then your keywords will match your customers’ search queries exactly every time a search is matched to your ad.
However, if you are taking advantage of broad and phrase match, oftentimes one keyword can generate hundreds or even thousands of search queries. It is our responsibility to take control of these search queries.
Do not forget this about keywords and search queries:
- Keywords are advertiser-centric assumptions—a targeting method to attract search queries.
- Search queries are customer-centric realities—your customers’ voice and, most importantly, clues to your customers’ intent.
B. The Goal of Search Query Inspecting
Through search query mining, you want to find:
- Keyword candidates: Good performers that you might have otherwise missed and that need to be promoted to keywords.
- Negative keyword candidates: Poor performers that need to be added as negative keywords, both as ad group negatives and campaign negative keywords.
As your query mining efforts mature you will find less and less irrelevant search queries and more new profitable long-tail keywords or even new high-volume search queries reflecting changes in your customers’ search behavior.
Now that we agree on the power of search queries, we will jump right into the world of search query mining.

C. Getting the Right Data from Google Ads Search Terms Reports
As with any PPC analysis, you must get the right data to answer your questions about the impressions, clicks, conversions, average CTR, average Cost/Conversion and so on.
In order to answer the questions about a search query’s performance we need the Search Term Report, for questions about comparison metrics we will need an Ad-Group Report, and for questions about duplication of keywords we will need a Keyword Account Structure Report.
- Search Query Report – Through your Google Ads interface you can pull a 30-day Search Query Report for the campaigns you want to use for understanding the procedure. Next, download the report as a .csv and open it in Excel. We will come back later to and format this report for our analysis.
a - Ad-Group Report – A big part of data-analysis is applying the proper context for PPC peer comparisons. For this analysis, you should be able to compare search query performance against the ad-group that it matched to. If you are wondering why you don’t just use the SQR data for this comparison, it’s because the SQR only reports on search queries that received a click. If you aggregated the SQR by ad-group it would show a much inflated CTR compared to the CTR that is reported in the ad-group report that contains all impressions. Now, pull your ad-group report for the same time-period and campaigns as the SQR you just downloaded. Download and open the ad-group report in Excel.
a - Account Structure – Exact Match Keywords – Next, copy your exact match keywords for the campaigns you are analyzing from Google Ads Editor and paste it into Excel. Again, this keyword data will be used for context during our analysis of your SQR. We will use this data to find duplicate search queries (search queries that are already in your account as an exact match keyword) and for comparing the individual words that make up your search queries as we mine for campaign negative keywords.
The reason we use this data source instead of the exact match search queries found in the SQR is because we want all keywords that are currently in your account not just keywords with impressions and the SQR is a performance report and will not show the current state of your account like Google Ads Editor will.
D. Put all the data in Excel
You should now have three sets of data (1. SQR, 2. Ad Group Report, and 3. Keyword Data from Editor). Next get them into an Excel workbook together. As with most data-mining exercises, data preparation will be a large part of the work and is crucial for being able to answer all of the questions we will have concerning our search queries’ performance.
II. Preparing the data for analysis of the Google Ads Search Terms Reports.
Now, we must take the time to prepare our data for analysis. This will include formating data as a table in Excel, creating derived fields in Excel, and creating a word count formula in Excel. We are going to use the power of Excel to our advantage and push our data to its limits to extract value.
A. Format your data as an Excel Table
- Highlight your entire SQR dataset including the header row.
- Click on “Format as Table” from the Home ribbon.
- Choose a style that you like.
- Click “OK”.
- Repeat these steps for both the ad group and account keyword structure datasets.
B. Flag Duplicate Search Queries
Duplicate search queries are broad and phrase match search queries that are already being targeted in your account as an exact match keyword. In other words, your broad and phrase match keywords might be ad-poaching your exact match keywords.
- Go to your Google Ads Editor keyword data and cut column C (keyword) and insert it at column A so that “Keyword” is your first column.
- Create a new column “DUP_CK” in your “sqr_data” tab.
- Type this formula or use the formula wizard in the new column created: =VLOOKUP(Table1,editor_kw_data!A:C,2,FALSE)
- After Excel is through processing, copy all of the new column and right click then “Paste Special > Values” back into column. This way every time you change something in Excel it doesn’t start processing through your data again.
C. Create a ‘Word Count’ column
We will use a search query word count later in the analysis process while we are surveying our data.
- Create a “WORD_COUNT” column.
- Type this formula: =LEN(A1)-LEN(SUBSTITUTE(A1,” “,””))+1
D. Create a search query ‘peer CTR’ column
Having a CTR comparison (or reasonable CTR expectation) will be very valuable for our analysis. In order to calculate a “Peer CTR” we must subtract the search queries clicks and impressions from the ad group’s total clicks and impressions and then calculate a CTR.
- Create a “PEER_CTR” column.
- Type this formula: =(VLOOKUP(Table1,adgroup_data!A:L,4,FALSE)-Table1)/(VLOOKUP(Table1,adgroup_data!A:L,5,FALSE)-Table1)
- [Friendly formula: (ag_clilcks – sq_clicks)/(ag_imp – sq_imp) = PEER_CTR]
E. Create a search query ‘peer conversion rate’ column
Like “PEER_CTR”, a comparison (expected conversion rate) is a great metric to have during your search query analysis. You create it very similarly to how you just created “PEER_CTR”.
- Create a “PEER_CVR” column (CVR = conversion rate).
- Type this formula in the cell: =(VLOOKUP(Table1,adgroup_data!A:L,10,FALSE)-Table1)/(VLOOKUP(Table1,adgroup_data!A:L,4,FALSE)-Table1)
- [Friendly formula: (ag_conv – sq_conv)/(ag_clicks – sq_clicks) = PEER_CVR]
F. Create a search query ‘peer cost/conversion’ column
In order for us to later look for a high CPA search query, we must have an average or expected CPA to compare against.
- Create a “PEER_CPA” column (CPA = cost per conversion) with the formula: =(VLOOKUP(Table1,adgroup_data!A:L,8,FALSE)-Table1)/(VLOOKUP(Table1,adgroup_data!A:L,10,FALSE)-Table1)
G. Create a ‘needed impressions’ column
In order to know how many impression are needed before we should expect to see clicks, we must calculate a needed impressions metric. We do this by dividing the number of clicks you would like to see by the peer CTR.
Of course, you could use a more “statistically significant” approach but the point is to create a flag that can be used to filter out search queries with sparse data later in our analysis.
- Create a “NEEDED_IMP” column.
- Type this formula in the cell: =1.5/Table1
H. Create a ‘needed clicks’ column
In order to know how many clicks are needed before we should expect to see conversions, we must calculate a needed clicks metric. We do this by dividing 1-2 clicks by the peer CTR.
- Create a “NEEDED_CLICKS” column.
- Type this formula in the cell: =1.5/Table1
I. Create an ‘enough impressions’ column
In this step we are going to use the “NEEDED_IMP” column that we created earlier with an “IF” statement to set a flag that we can use as a filter later in our analysis.
- Create an “ENOUGH_IMP” column.
- Type this formula: =IF(Table1>Table1,”Y”,”N”)
J. Create an ‘enough clicks’ column
Again we are going to use a derived field that we created earlier, “NEEDED_CLICKS” to set a flag for “ENOUGH_CLICKS”.
- Create an “ENOUGH_CLICKS” column.
- Type this formula in the cell: =IF(Table1>Table1,”Y”,”N”)
K. Create a ‘low CTR’ column
This is a very important filter that helps us focus on search queries with below average CTRs. The formula described below will set a flag for “LOW_CTR” for search queries with a CTR that is 30%+ below its peers in that ad group.
- Create a “LOW_CTR” column.
- Type this formula: =IF(Table1<(Table1*0.7),”Y”,”N”)
L. Create a ‘low conversion rate’ column
Just like low CTR, a below average conversion rate can be an attribute of a negative keyword candidate.
- Create a “LOW_CVR” column.
- Type this formula in the cell: =IF(Table1<(Table1*0.7),”Y”,”N”)
M. Create a ‘high cost per conversion’ column
A high CPA can also offer insights into potential problems with a search query. The search query may perform better with a different landing page or perhaps it needs to be added as a negative keyword. The formula below sets a flag for search queries that have a CPA 30%+ above its peers.
- Create a “HIGH_CPA” column.
- Type this formula in the cell: =IF(Table1>(Table1*1.3),”Y”,”N”)
This might seem like a lot of work, but once you get familiar with these techniques it should only take you about five minutes to create all 12 columns. You can also experiment with creating your own derived fields for your analysis. Start by formulating the questions you will be asking of your data. This will help you figure out what new fields, flags, etc. you will need to answer those questions.

III. Acting on the insights generated for the Google Ads Search Terms Reports.
A. Analysis of data using Excel
For the most part, these questions are focused around search queries that may need to be added as negative keywords and search queries that need to be a part of a keyword expansion strategy. Start your query mining analysis with a quick survey of your data.
1. Survey your data
The really bad and obvious waste can sometimes be seen easily in your data by just sorting by cost and filtering for zero conversions, etc., so a quick survey of your data is always advised. Know your data. Use a pivot table, sort, and filter. The more you learn about your data, the better equipped you will be for the analysis process.
A good example of this would be creating a pivot table to see how much duplication is happening.
- Select a cell in your ‘sqr_data’ worksheet.
- Insert a Pivot Table.
- Add ‘DUP_CK’ to the Row Label.
- Add ‘Search Term’ to the Values and Count.
- Add ‘Match Type’ to the Report Filter and filter out the exact match search queries.
See if you have an issue with duplication. Depending on your results, you may need to invest some time to reduce the amount of ad-poaching that is occurring by the creative use of negative keywords (i.e., add the exact keyword negative to the broad and phrase match ad group where the duplication is occurring).
While you are surveying your data, go ahead and filter for zero conversion search queries as well as search queries with zero clicks. Look for the easy stuff before we jump into the more advanced analysis.
2. Create your negative keywords list
One of the main reasons for search query mining is to find negative keyword candidates, or words and phrases that might need to be added as a negative keyword inside your ad groups or campaigns. Because of the time we spent preparing our data, creating this list will be much easier.
Ad group level negatives will be based primarily on the search query’s performance when compared to its peers in the ad group. If it’s performing badly, most likely you will need to add it as a negative and let another ad group worry about it. If you think it’s relevant you may need to move it to another ad group (as a keyword) with better aligned ad copy or landing page.

This is how you create your list of negative candidates: Filter for ‘DUP_CK’. Choose ‘#N/A’- this will leave only non-duplicates.
- Filter for ‘LOW_CTR’.
- Filter for ‘zero conversions’.
- Filter for ‘ENOUGH_IMP’.
- Copy the resulting data into another worksheet and rename it ‘negative candidates’.
- Repeat this process for your ‘LOW_CVR’ and ‘HIGH_CPA’ search queries.
You now have a dataset that is a fraction of the size of your original search query report. Because these search queries are below average in some way, they are much more likely to need to be added as a negative search query.
Of course, you can and should play around with your comparison thresholds. In this example we used ad 30%+ below average comparison. Depending on your situation you may need to be more or less aggressive. For example if you are analyzing 300K rows of data you might want to start with an 80%+ below average comparison for CVR or CTR and drill right to the horrible stuff. Search query mining is part art and part science. Regardless of the thresholds you choose, you now should have a much more manageable list of search queries to work through.
3. Create your keyword expansion list
Your raw search query data most likely consists of thousands of rows of data, so we need a good way to pull the good performing search queries out and create a keyword expansion list. Don’t add new keywords to my account unless they have enough activity (clicks) for them to be treated differently.
An easy way for us to do this is to:
- Filter for search queries that have resulted in a conversion.
- Filter for ‘ENOUGH_CLICKS’.
- Filter for ‘N’ on ‘HIGH_CPA’ (might be a good idea to do a quick pivot and find out how many of your converting search queries have a high CPS).
- Copy and paste this data into another worksheet and rename the worksheet to keyword_expansion.
You should now have your negative candidates and keyword expansion list ready to be worked. These lists will be around 1-3% of your original search query report, making them much more focused and easier to work with.

B. Analysis of data using ReportGarden
And of course, if you’re either not comfortable mucking around in Excel with large volumes of search query data or simply don’t have the time, ReportGarden can be of great help. ReportGarden is our PPC & Google Ads Reporting Tool which lets you automate the work of mining search query data to bubble up important insights about your campaign. You can try the tool for free!
This infographic clearly gives the step-by-step process to be followed to create Google Ads Search Term Reports using ReportGarden.
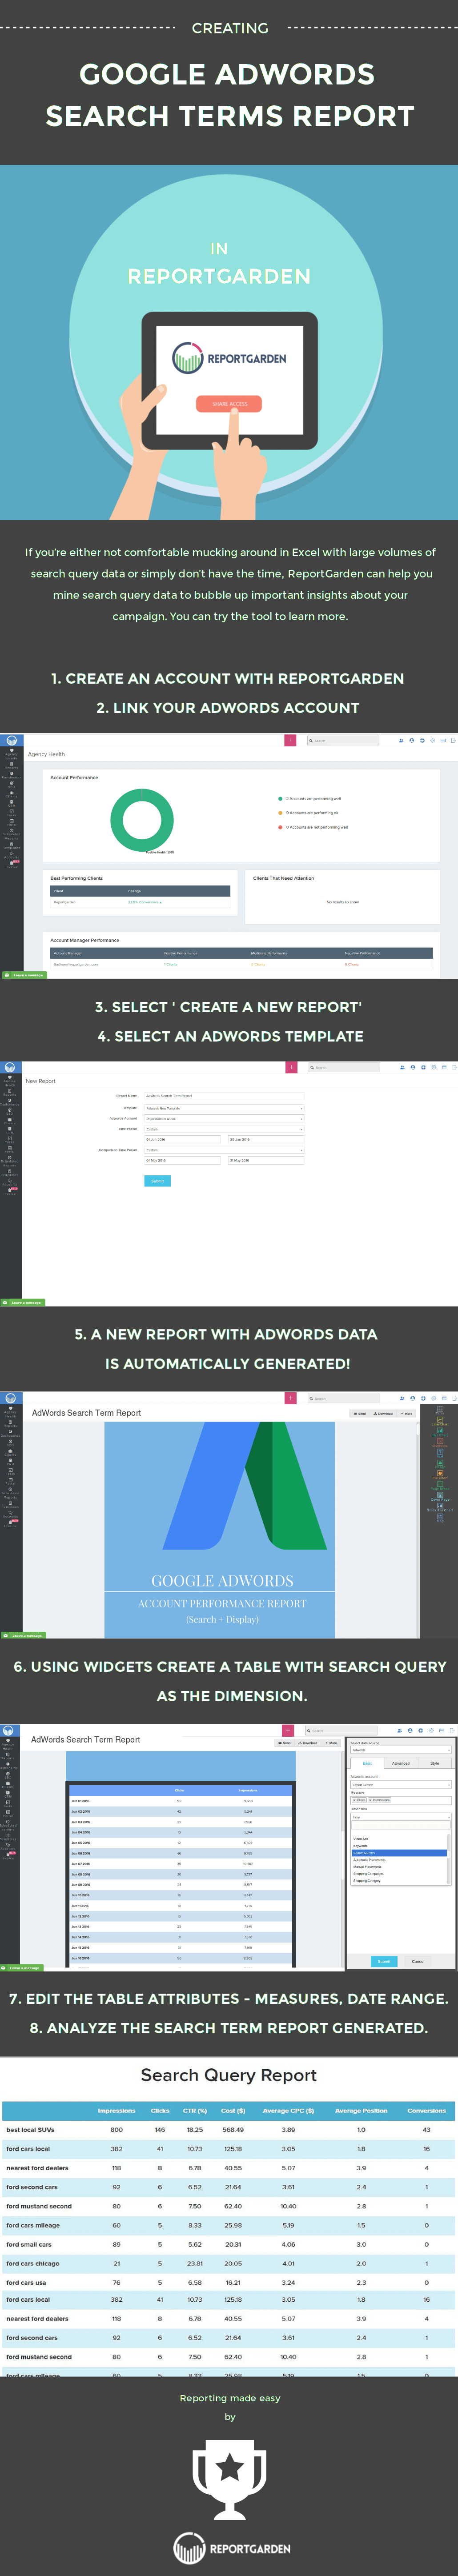
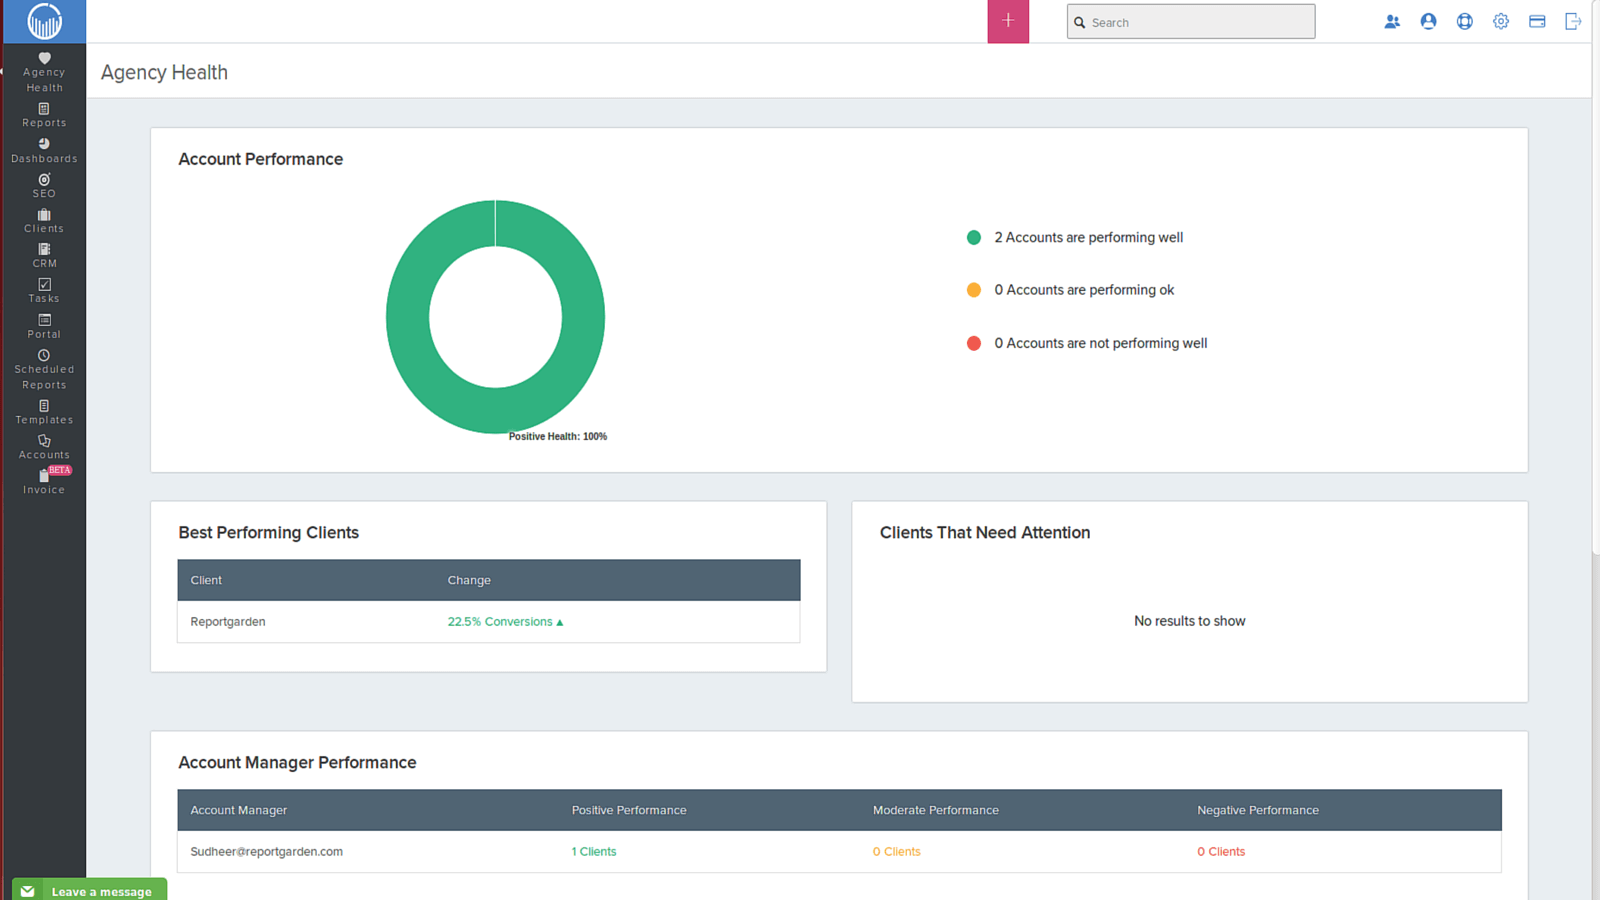
In order to access the various Custom Google Ads Reports available in ReportGarden, you need to Sign-up with ReportGarden and create your account. And also link your Google Ads account with this account.
1. Select New Report option available in the Reports option on the left side of the screen.
2. Name your report and select a template that will generate your report in the required format. For example, for this search term report we can select Google Ads New Template from the options available.

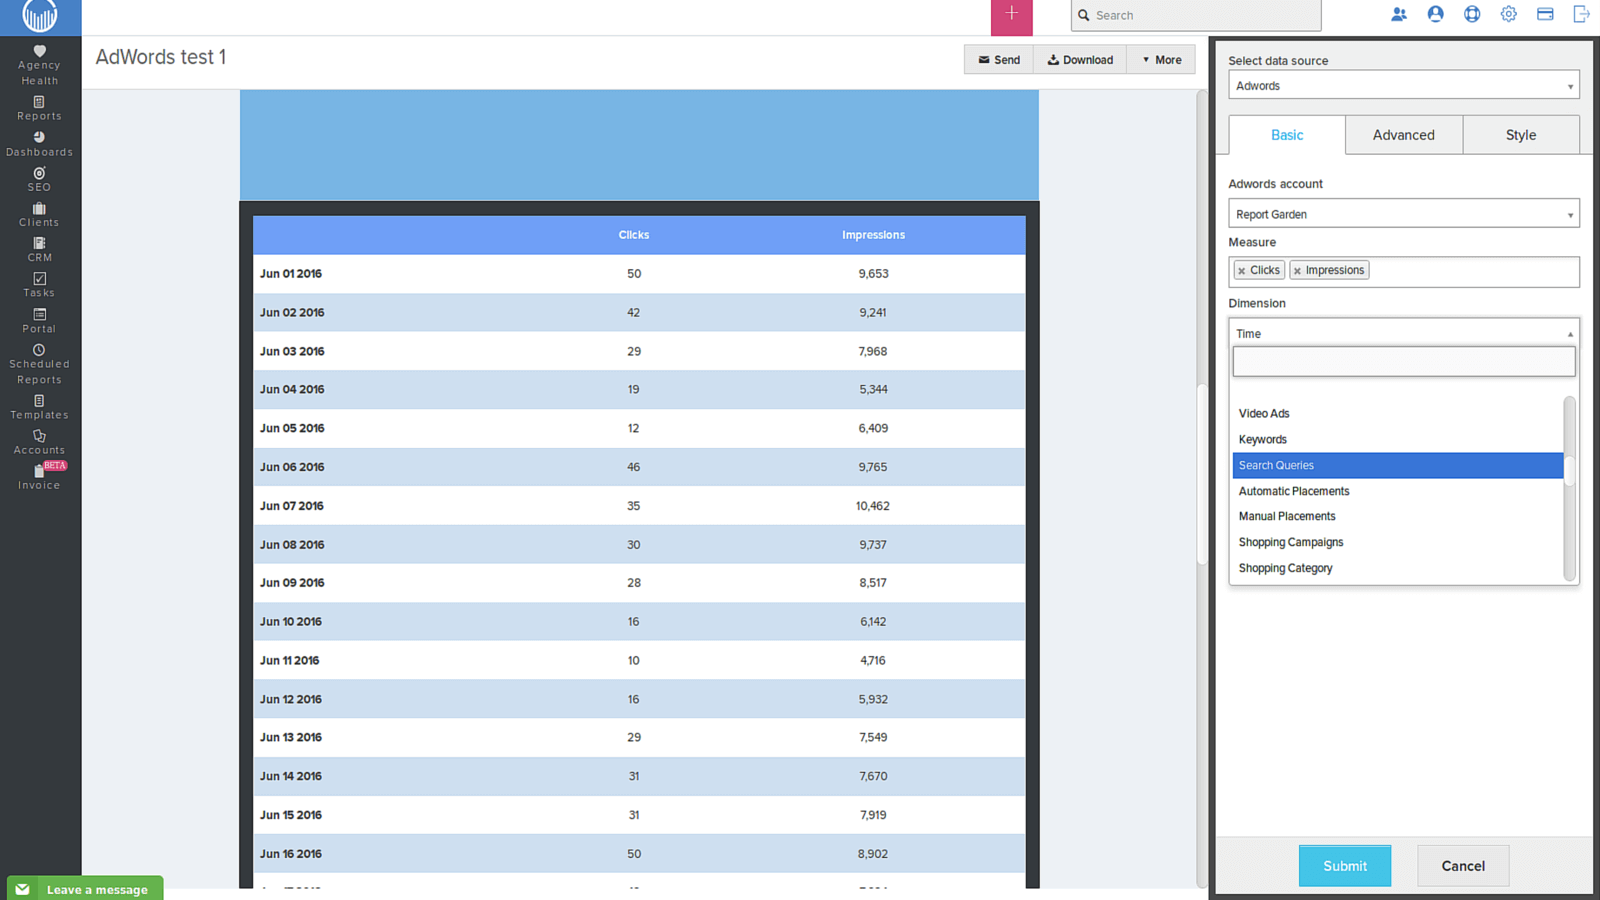
Select your Google Ads account from the drop-down menu of the Google Ads Account and also the time period that you would like to analyze the campaign for.
After submitting the details your screen would look like this.
Each page of the report can be modified according to the interest of the client with various text formats and custom colors with the edit option on the receptive pages.
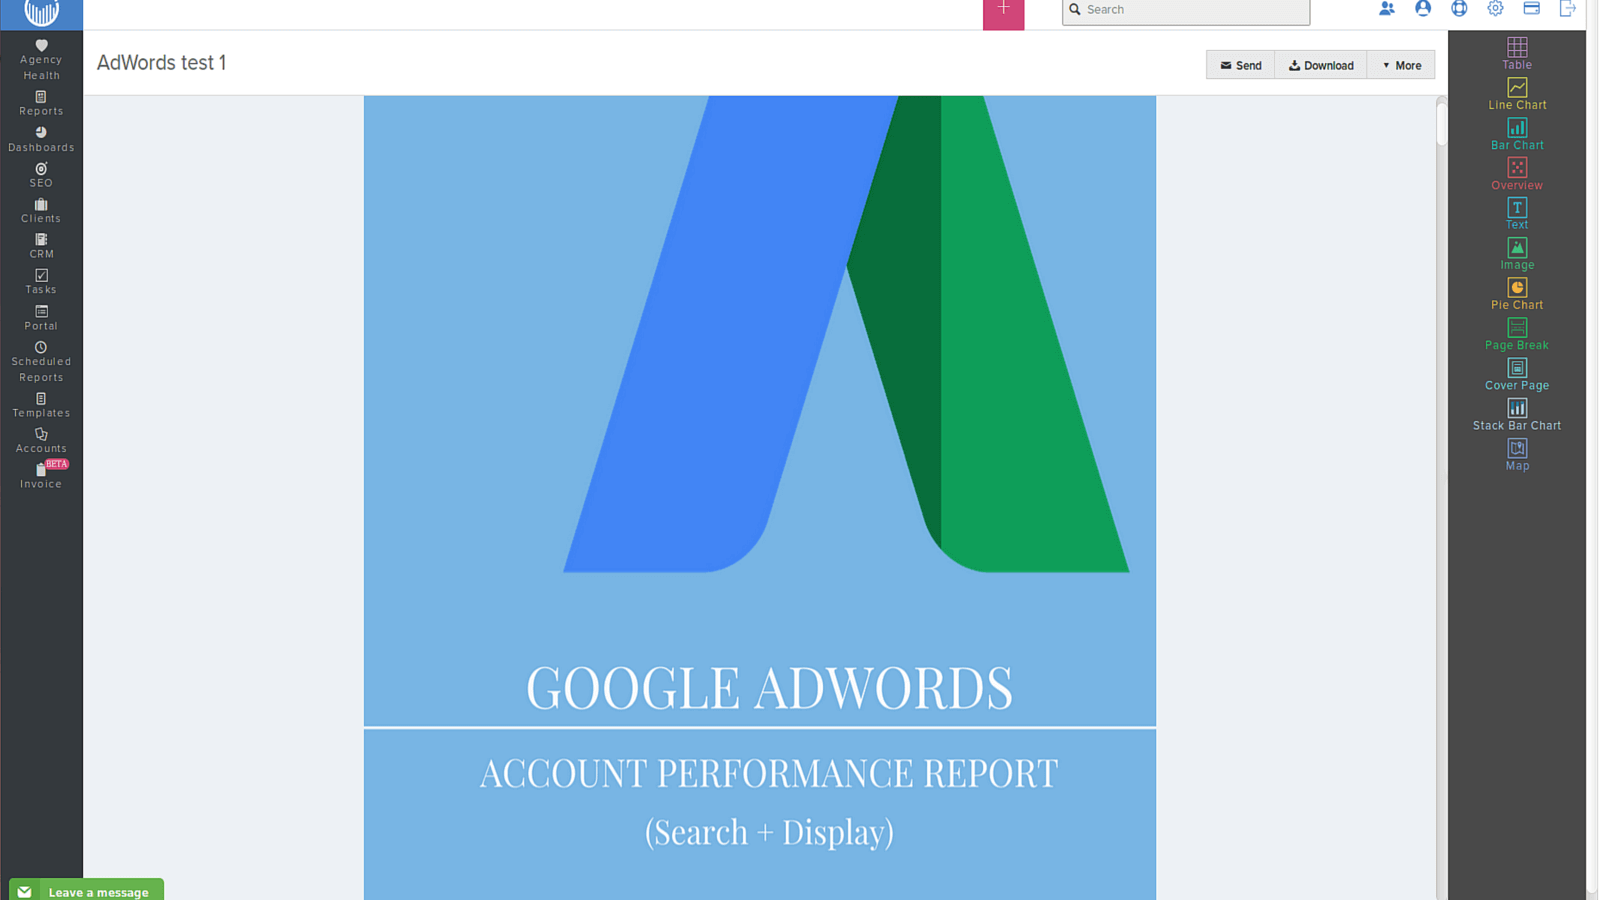
3. This cover page is followed by various performance reports that are all included in the Google Ads reports.
4. Since we are looking for a Search Term report, we can delete all the other performance reports except the search queries sheet. When ever they are needed they can be added back into the report easily with the widgets and the dimensions available.
This search queries table can also be created using the widgets on the right side of the screen and by selecting the Dimension for the table as ‘Search Queries’.
5. The table can now includes all the parameters that would ease the analysis of the search queries.
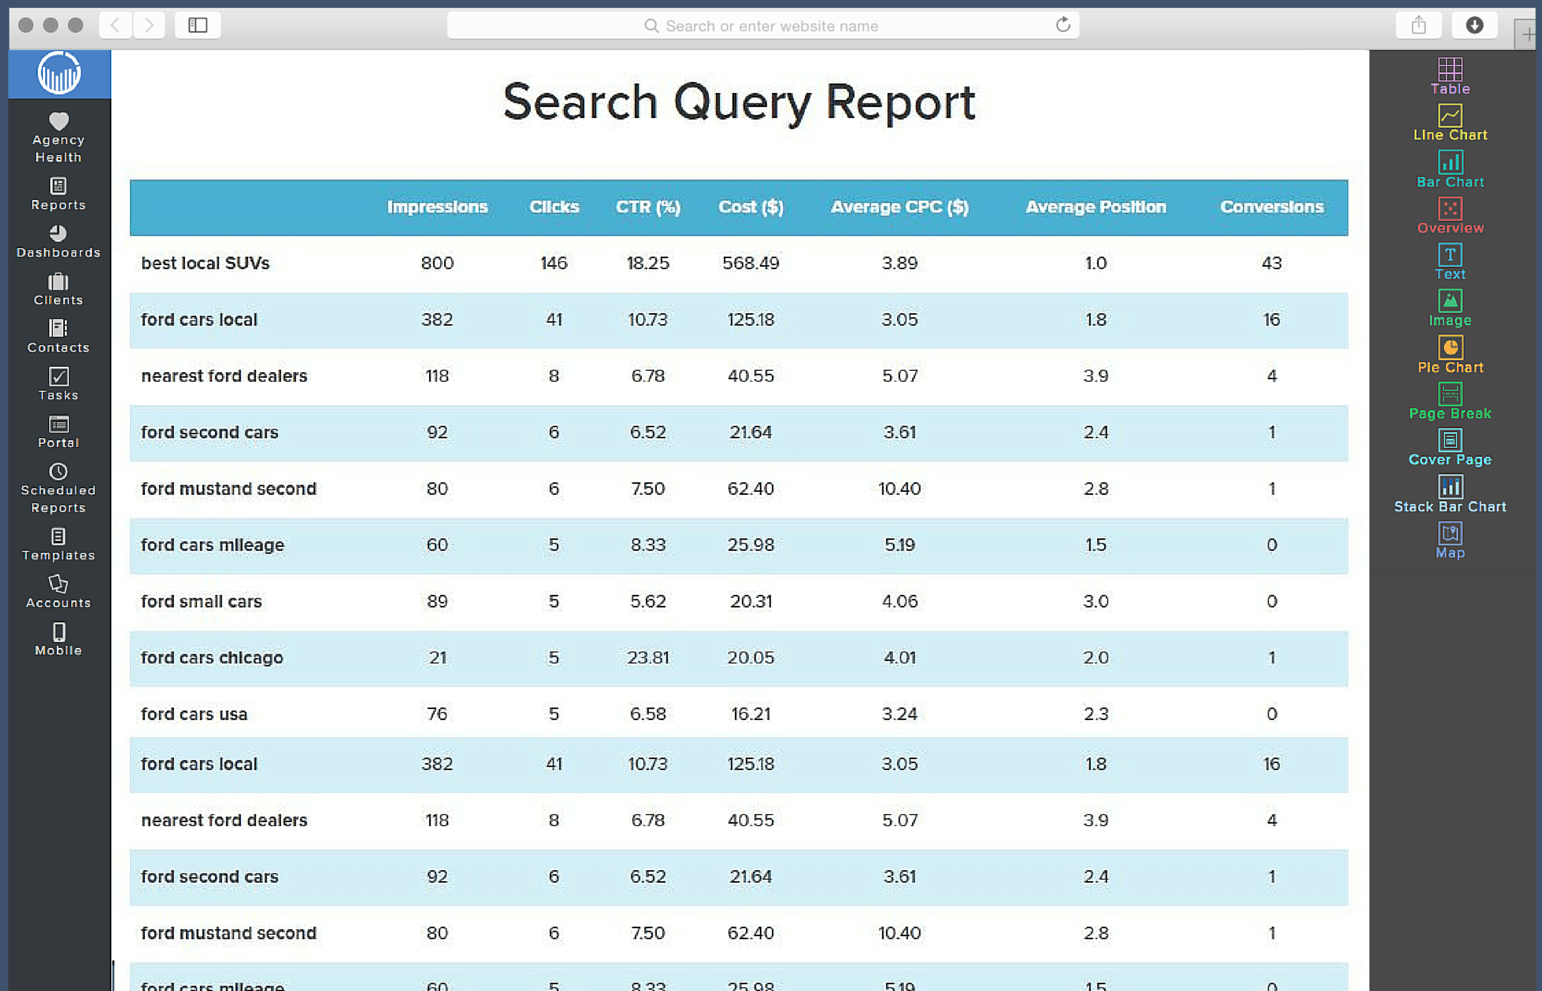
6. You can also arrange these search terms in ascending/ descending order based on any measure used in the table like impressions, clicks, CTR% or others by using the options available in the advanced setting options in the edit menu.
7. You can now play with the visualization tools available by changing every attribute in the table by adding filters and also understand the effect of each of the measure on the overall performance of the ad campaigns run.
C. Work on your Negative Keywords list
There are several factors that could be impacting the performance of your search queries, but one major reason that you have poor performing search queries in your ad group is because of the way Google matches search queries to your broad match keywords. Google’s idea of broad is just about as broad as you can imagine, and sometimes even broader.
In order for a search query to be on the negative candidates list, your search query has already demonstrated that it doesn’t belong in the ad-group that it’s matching to—it has very poor CTR and CVR. These search queries are not working with your existing ads. There is really no good reason not to just add the entire list as ad-group-level negative exact match keywords, preventing them from matching to your broad match keywords in the future.
D. Work on Your Keyword Expansion List
Adding new keywords to your account is more difficult. You must make sure they find a good home (ad group). At a high level, you copy your keyword expansion list for the campaign and distribute it into appropriate ad groups. The challenge is finding the appropriate groupings/ themes of your new keywords. There are a couple of ways you can approach this problem.
- Manually scan your keywords looking for themes that match to existing ad groups and keywords.
- Use the Google Ads Editor Keyword Grouping tool.
A good place to start is by using your existing ad groups and keywords as the criteria for filtering your keyword expansion list. If you have a well built out campaign then you probably have most of the groupings already.
For example: let’s pretend that you sell dog food and dog food accessories. It’s safe to assume that you already have a dog food bowl ad group, so you should filter your keyword expansion list by the word ‘bowl’ in Google Ads Editor. The resulting list will be all of your new keywords that contain the word ‘bowl.’ From here you can just drag-and-drop your keywords into the ‘bowl’ ad group or ad groups. Similarly, you can use the output of one of the grouping tools as your filtering criteria and then distribute your keywords.
The Google Google Ads Search Terms Report is a highly valuable report. It contains detailed information about your keywords and how well they are performing against users’ search terms. It’s vital to optimize your keywords to ensure your ad is being triggered by relevant search terms. You can also use the STR to identify new keyword opportunities and the negative keywords you don’t want to trigger your ad.

Learn more about how you can automate your Google Ads Client Reporting!
.png)


