If you own or work at a marketing agency, you know that reporting your results and providing business intelligence to clients in a clear, concise, and professional way is just as important as the performance metrics themselves.
Marketing agencies have traditionally limited themselves to tedious manual reporting, using tools like Google Workspace to piece together scattered information for clients. While that can work when you’re just getting started, as you grow, manual reporting becomes a tedious, time-consuming task that doesn’t actually contribute to your bottom line.
If you’re looking to create reporting dashboards with a more automated approach, this article is for you.
In this article, we’ll discuss:
- What you gain and lose by switching to an automated software from manual reporting
- A step-by-step process for creating a report with ReportGarden.
Want to try out the new ReportGarden? You can sign up today for our free 7 day trial.
The Tradeoffs Between Manual Reporting vs. Using a Dashboard Reporting Software
Young agencies need to focus on landing new clients, getting them results, and reporting cost-effectively.
As you start to scale, however, reporting can become very time consuming, and you may start to feel that the reports you’re sending are not as impressive as you’d like them to be. Coupled with the fact that many other agencies send similar reports, yours are likely to blend in rather than stand out and impress.
Before we drill down into how to automate your reporting process, let’s review a few of the pros and cons of manual reporting versus using a dashboard reporting software like ReportGarden.
Manual Reporting
The Pros
- Affordability: The benefit of starting with manual reporting is that it’s inexpensive (aside from the time-cost).
- Ease of use: Admittedly, it’s relatively easy to piece together tools like Google Docs, Sheets, and Slides. They allow you to create the basic reports your agency needs, and they’re also easy to share with your clients.
The Cons
- Opportunity Cost: The main downside of this approach to reporting is that the time needed to manually create each report adds up quickly. That time could be spent on higher-value, revenue-generating tasks like prospecting or improving the results you’re getting for clients.
- Unoriginal: Another downside is that many other agencies report their results this way too, so you miss the opportunity to use reporting as a competitive advantage.
Dashboard Reporting
The Pros
Automated Reporting: One of the main advantages of dashboard reporting softwares is the ability to automate the process. Once you’ve set it up, automated reporting gives you loads of time to invest into higher value tasks.
Consolidated Business Dashboard: Marketing agencies can display a more complete picture with a business dashboard. You’re still able to report the same key performance indicators (KPIs) as a manual report, but your client can now login and review results in real-time too. This not only improves their decision making, but also builds trust through transparency, whereas many of your competitors may not offer this functionality.
The Cons
- Complete Client Access: Giving your clients 24/7 access to your agency’s results leaves too much room for them to jump to unfounded conclusions. To solve this potential issue, ReportGarden allows users to provide additional context alongside the KPIs you’re reporting, which further builds on the trust and transparency that a marketing dashboard provides.
Who Needs Marketing Reporting Dashboards?
Marketing professionals of all sizes, from freelancers and entrepreneurs to agencies and enterprises stand to benefit from using a reporting dashboard rather than making reports manually.
This guide can help anyone trying to leverage dashboard reporting tools to streamline their marketing and reporting processes once and for all.
A reporting dashboard simplifies many functions, like:
- Client Communication
- Client Management
- Performance Tracking
- Team Collaboration
- ROI Tracking
- Budget Allocation
- Strategic Decision Making
This survey showed that 27% of participants believe that marketing functions have the most need for automation, even more so than sales and accounts.
HubSpot’s State of Marketing 2021 reported that marketers are using automation 76% more than sales and 139% more than finance, highlighting the shift from manual time-consuming marketing to a faster, convenient method that assists client integration.
It also found that 77% of agencies saw increased email marketing engagement after switching to a more personalized, automated approach.
Forrester’s survey of Microsoft’s Power BI showed that using an automated business intelligence software helped companies to save up to 125 hours per year, and reduced centralized team analytics efforts by 42%.
Marketing Agency Reports: The Essentials
If you’re just getting started with automated dashboard reporting tools, here’s a list of some of the most important agency reports that can help you keep clients in the loop with metrics that matter.
Social Media Report
Summarize the performance of your client’s Social in one comprehensive report, highlighting how your efforts are growing the brand and revealing potential areas of improvement that can be tweaked for better results.
Depending on the goal of each campaign, the featured KPIs may differ, but these a few key metrics that must be included in any insightful social media report:
- Reach: How many social media users see your content, including KPIs like Impressions and follower growth.
- Follower growth: [(Current Followers - Previous Followers) /Total Followers] * 100
- Follower growth: [(Current Followers - Previous Followers) /Total Followers] * 100
- Engagement: How users interact with your content on social media. These KPIs include comments, shares, ‘likes’ or ‘reacts’, or Click-Through Rate (CTR), which is the rate at which users clicked a link in your content that redirected them to another domain such as your page.
- CTR: (Total Clicks /Total Impressions) * 100
- Conversions: Data on whether leads are fulfilling the actions that contribute to the business’ bottom line, like making a purchase. This considers KPIs like conversion rate, cost per conversion (CPC), and so on.
- Conversion rate: (Conversions / Total Clicks) * 100
- CPC: Total Cost / Total Conversions
- Key Insights: Social reports reports offer detailed information on:
- Consumer Intelligence
- Brand Sentiment
- Ideal post timings
- Most engaging content types
- Historically successful strategies
- Technical content errors.
- Action Points:
- Marketers can use these reports to adjust their content strategy and target higher performing platforms.
- They elucidate which parts of your Social are lacking. Your team can extrapolate how to fix those areas and enhance your marketing for better growth. For example, if your posts enjoy high reach but suffer from low engagement, offering more valuable content based on audience analysis can help improve it.
- Social reports also explain to clients exactly how and what the agency is doing to elevate their business in a clear, concise manner
SEO Reports
SEO is a crucial part of any brand’s online presence if they want to stand out from the crowd in the competitive landscape dotted with transient audience behavior and algorithms.
SEO Reports are a highly beneficial asset that can tell agencies exactly why their online presence is falling off and how they can get better visibility by constantly improving their SEO strategy. Some key metrics of this report are:
- Keyword Ranking: The ranked positions of targeted keywords in a Search Engine Results Page (SERP). It determines how relevant your article is to the topic that’s searched, influencing how likely users are to see your blog based on that relevance.
- Traffic: The flow of visitors to your website from various paid and organic sources and from various devices. Understanding these metrics lets you explore the best performing platforms to invest your time into when drafting your next strategy.
- Backlinks: The total number of links from external domains that redirect users to your web page.
- Site Speed: The average page load time of your website.
- Bounce Rate: The percentage of users who leave your site after viewing a single page only.
- Calculation: (Total single-page sessions) / (Total entries into the site)
- Key Insights: There is a wealth of information to be gleaned from an SEO report.
- Quality of the content on the webpages and whether it touches on everything consumers are concerned with regarding that topic.
- It showcases the differences in you and your competitors’ strategies, such as keywords your competitors rank for that you don’t.
- SEO reports show which pages get better traction than others which can help with reallocating time and effort into perfecting the overall campaign.
- You can identify the best sources of traffic and the platforms and devices they use to improve your audience targeting.
- Action Points:
- Using SEO Reports can be made much simpler by employing an SEO Reporting tool to do the legwork while you take over decision making to drive real growth.
- Analyze whether the content adheres to SEO best practices like having the ideal keyword density while avoiding keyword stuffing, redundant content, plagiarism, and so on.
- Audit the pages for technical errors like slow page load times, counter-intuitive UI and crawl errors that could harm your page’s SERP rank.
PPC (Pay Per Click) Report
These reports underline the performance of paid campaigns and help measure the Return on Investment for your marketing efforts.
All Social strategies use paid advertising, but at the end of the day the returns gained must justify the amount spent on those ads. That’s why, functional paid performance reports include metrics like:
- Ad Frequency: How often users see your ad.
- Total Clicks: The number of people who click the ad.
- Cost Per Click: The cost incurred for a single click on the ad.
- Cost Per Lead: The average cost to generate a single lead, such as users who submit a contact form or register for a free trial of your service.
- Calculation: Total Investment / Total Leads Generated
- Cost Per Acquisition: The cost incurred for a single conversion if a lead actually contributes to revenue in some way, such as making a purchase.
- Calculation: Total Investment / Total Acquisitions
- Calculation: Total Investment / Total Acquisitions
- Return on Ad Spend (ROAS): The revenue earned versus the amount spent on an ad campaign.
- Calculation: Ad Revenue / Ad Spend
- Key insights: PPC reports show how your paid ad campaigns fare and whether or not they contribute to the bottom line. They can reveal insights related to factors like:
- Paid campaign reach
- Audience demographics
- Content Relevance
- Targeting Accuracy
- Return on Investment
- Action Points: This report can be used to streamline your ad strategy by:
- Identifying areas of irrelevant targeting where the ad may not necessarily be low quality but is being displayed to the wrong audience.
- Analyzing brand sentiment and using social listening tools to better understand what audiences want from your business.
- Thoroughly studying successful ad content and design features to replicate and retain leads.
- Implement A/B Testing to experiment with types of content that may provide better results.
Email Marketing Report
Such reports summarize the performance of email campaigns, which can be a major asset for many businesses.
Having the right strategy that understands what consumers really want is paramount when drafting your email marketing plans. That’s why, helpful email marketing reports must consider factors like:
- Open Rate: The percentage of people who open your emails out of the total people who receive them.
- Calculation: (Opened Emails / Number of Recipients) * 100
- CTR: The rate of users clicking on a link in your emails. A healthy CTR for email marketing can be between 2-5%.
- Calculation: (Number of Clicks / Delivered Emails) * 100
- CTOR (Click To Open Rate): The percent of people who opened your email then clicked a link inside it.
- (Number of Clicks / Opened Emails) * 100
- Note the difference between CTR and CTOR: Although similar, the two measure clicks in different circumstances, that is, links clicked out of all delivered emails versus clicks within opened emails.
- Bounce Rate: The rate at which emails were returned to the sender because the recipient cannot receive the message. This may be caused due to many reasons, such as repeated spam complaints against the sender, or if the recipient’s email doesn’t exist, and so on.
- Calculation: (Bounce Rate / Delivered Emails) * 100
- Unsubscribe Rate: The rate at which recipients unsubscribe from your mailing list. Generally, a rate below 2% can be acceptable.
- Calculation: (Unsubscribed users /Delivered Emails) * 100
- Conversion Rate: The percent of people who perform the action specified in the email such as clicking a link or subscribing.
- Calculation: (No. of Recipients who took the specified action / Delivered Emails) * 100
- Key Insights: Studying the aforementioned metrics can help understand whether your email marketing is working as expected. They can reveal things like:
- Content Effectiveness and Performance
- Ideal Email Frequency
- Best Sending Times
- Subscriber Engagement
- Consumer Behaviour
- Action Points: Marketers can improve their email strategies by studying their email marketing reports.
- If the CTR is low, it may mean your emails don’t feature engaging content that persuades the reader to click on the attached link.
- If the CTOR is low, your emails may not be going to the right audience.
- Marketers with high unsubscribe rates could try altering the content quality and email frequency to ensure higher engagement and audience retention.
- Better CTAs and A/B tested subject lines can help boost engagement as well.
As mentioned, if you do go with a dashboard reporting SaaS, there will be some initial setup required, so now we’ll cover a step-by-step process that you can use to automate your agency’s reporting.
Step-by-Step: How to Set Up Reporting Dashboards with ReportGarden
Improve your marketing efficiency by using ReportGarden’s automated dashboard and reporting software. Create your dashboards and provide 24/7 access to your client, or export it and schedule periodic emails based on your preference!
Compared to creating custom reports in Excel, save tons of time by using ReportGarden versus manually importing the data, sorting it, and creating your own data visualizations. Here’s how.
Step 1: Creating a Client

- Input your client’s URL and ReportGarden will automatically pull in the relevant information.
- You can then add a few client-specific preferences such as uploading a photo, selecting an account manager, and choosing the language and timezone.
Step 2: Connecting Your Data Source(s)
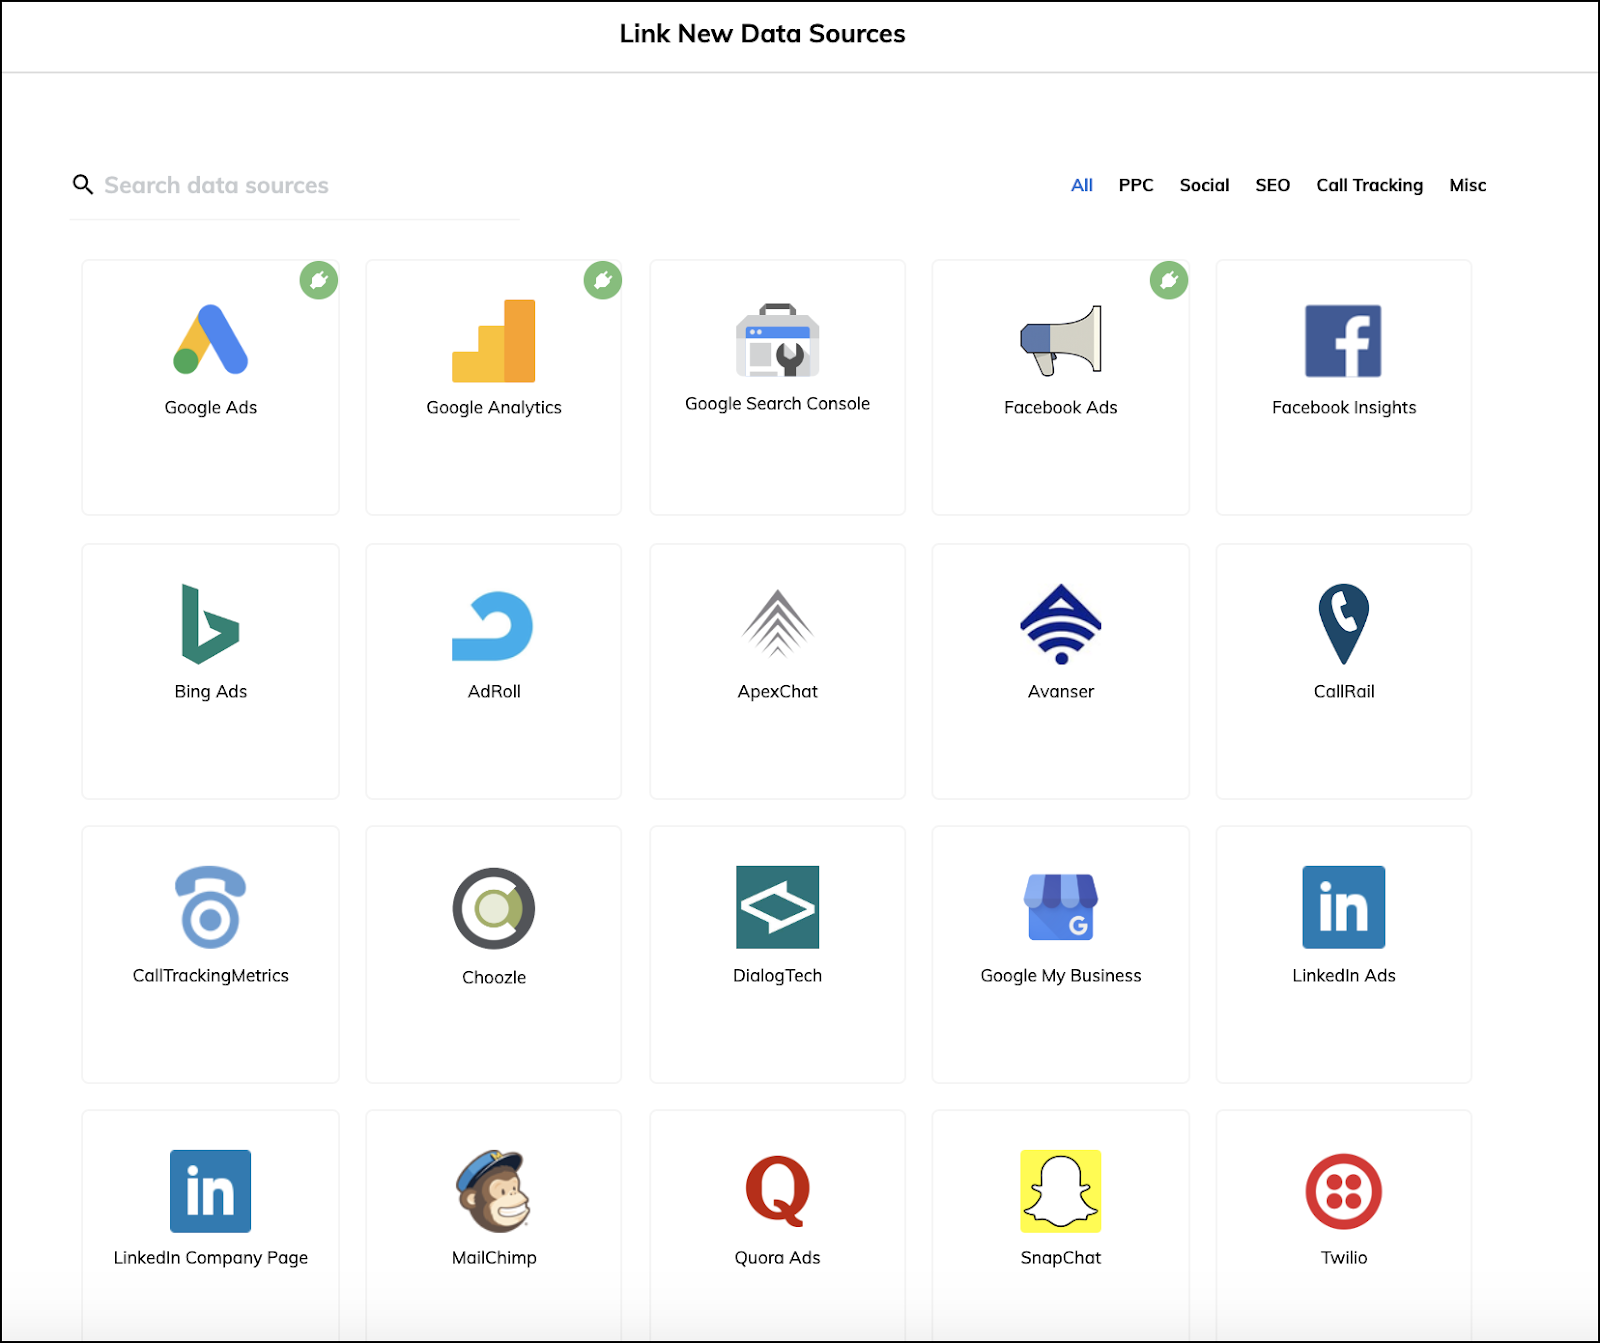
- Use one of ReportGarden’s templates or create a custom, white-labeled dashboard.
- Simply click “Link a New Data Source”, authorize the connection, and ReportGarden will then provide a list of entities that you can pull from.
- A unique aspect of ReportGarden is that within each data source, you can tap into different data profiles. For example, if a client has two separate Google ads accounts you can tap into data sources from multiple logged-in accounts.
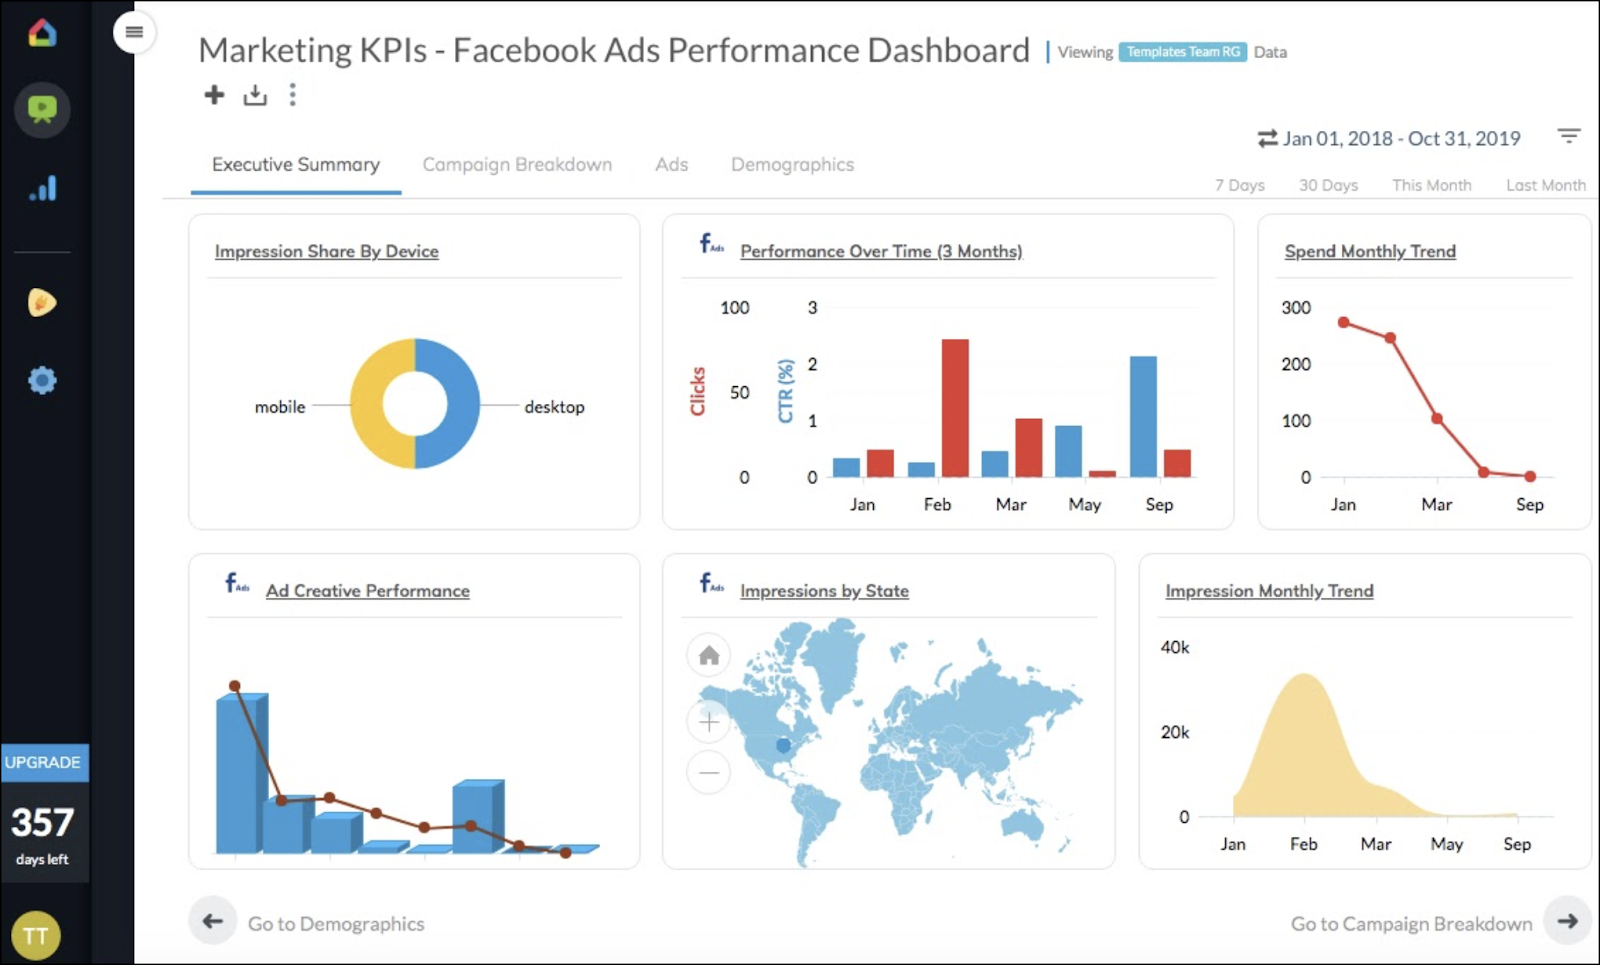
Step 3: Creating a Dashboard
- ReportGarden automatically populates your dashboard once you’ve integrated your data sources.
- ReportGarden allows users to pull from multiple data sources into a single dashboard. For example, if you want to cross reference Google Analytics with your Facebook Ads data, it’s just a few clicks away.
Step 4: Choosing a Report Template (or Creating a Custom Report)
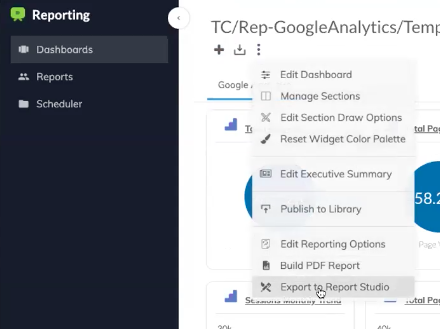
- Once you’ve populated your dashboard and pulled in the KPIs you want to report, you can then choose to export either a report template or create your own custom report.
- If you want to periodically send clients static reports, simply select the date range and the KPIs you want to report, and within seconds you’ve got a client-ready report to send.
- If you choose to create a custom report from scratch, navigate to ‘Reports’ in the left-hand panel → ‘Create from Scratch’
- Add the widgets you need and connect them to live data APIs or a specific data source.
- Specify the dimensions and measures according to your needs.
- Choose from a broad range of data presentations; pull the entire connected library of data points or just add data widgets for a specific report – however you prefer.
- You can select from one of our many design templates that pull data from your dashboard and have a familiar PowerPoint-style presentation. You don’t need to be a designer to make these reports stand out from your competitors.
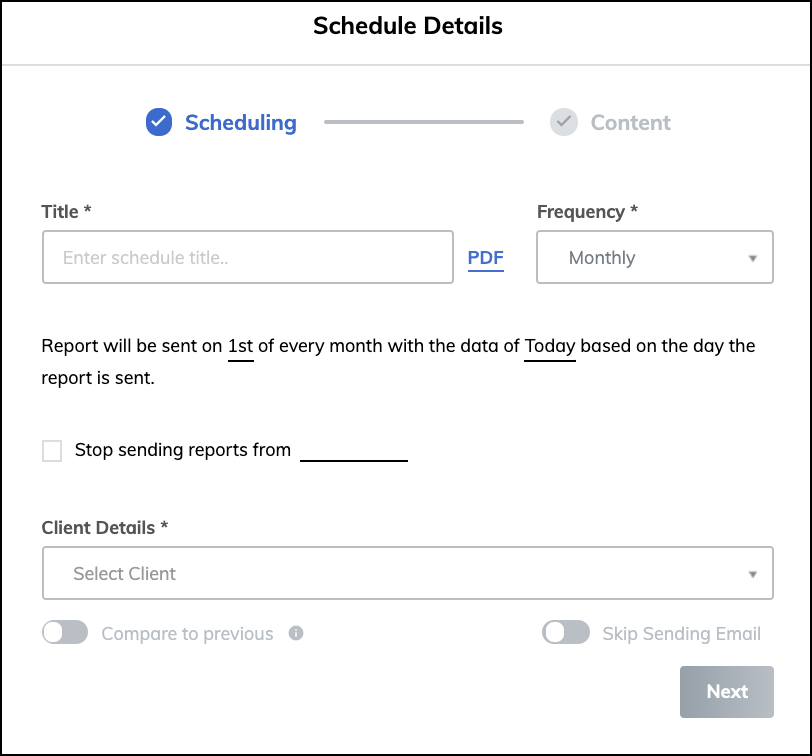
Step 5: Scheduling Reports with ReportGarden
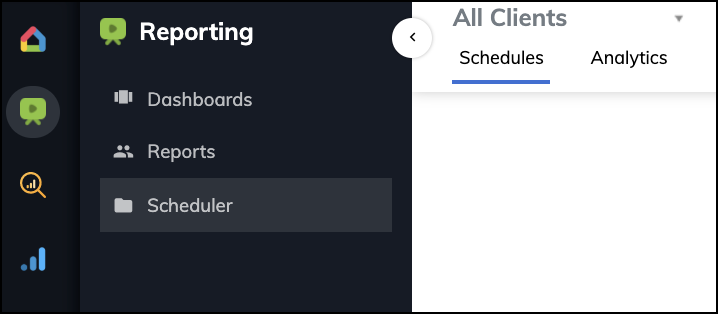
- It’s important to note that with a dashboard reporting software, you can either provide 24/7 client access to a dashboard or you can export a static PDF report that you send to clients periodically.
- Depending on the type of service you’re providing to your clients, after you’ve created your client dashboards and generated reports for them, you can then automate this entire process by scheduling them to be sent out periodically.
- You can also provide access to the client’s dashboard so they can follow along with your progress at their own convenience.
Step 6: Giving Your Client Access to the Dashboard
- If you choose to provide your client 24/7 access to their dashboard, once the dashboard is client-ready, click “Invite” from within the dashboard and the client will receive an email invite with their login credentials.
- Your client will then have view-only access to the dashboard and will be able to adjust the date ranges as they see fit.
Best Practices for Reporting
Now that you understand how to automate your dashboards and reporting process, let’s take a look at some reporting best practices to keep your reports at the top of their game.
- Maintain Relevance and Accuracy
- Check that the data in your reports is accurate and that it pertains to the audience’s goals.
- Exclude irrelevant metrics that distract from the main purpose of analyzing the report.
- Clear Labeling and Visualization
- Display data visually and clearly label all charts, graphs, tables, and other widgets to avoid confusion and improve comprehensibility.
- Use features like ReportGarden’s White Labelling to brand reports with your company’s style and name for a professional result.
- Customization
- Study your audience before making the report and tailor it according to their level of expertise, needs, and goals.
- Avoid technical jargon wherever necessary and maintain brevity.
- Context
- Provide insights, explanations, and actionable recommendations alongside raw data to avoid miscommunications.
- Transparency
- Be completely open with clients about the reports; provide full access when necessary to build trust and retain clients.
Summary: Using Reporting Dashboards to Increase Efficiency and Impress Your Clients
As we’ve discussed, there are tradeoffs between manually creating your own ad-hoc reports versus using a dashboard reporting software. When you’re just getting started, using free tools is often the best choice, but as you scale, it’s time to consider automating the reporting process.
Aside from the time you save manually creating reports, one of the main benefits of using a dashboard reporting software is that your clients have 24/7 access to their results. This builds trust that other “black-box” digital marketing agencies simply won’t have.
You can also tell a more complete story of the results you’re getting for clients by providing extra context alongside the KPIs in your marketing dashboards.
Combined with the ability to schedule and automate the delivery of your reports, these features all work together to free up your time to focus on what matters: increasing your clients’ bottom line.
If you want to see for yourself how ReportGarden can automate your marketing agency reporting process, you can start your free 14 day trial here.
.png)


