
When you’re managing and reporting on social media campaigns for several clients, you need:
- Quick access to social media analytics across campaigns and platforms
- Differing levels of visibility into, and updates on, client campaigns.
Pulling that data together manually takes hours. But a dashboard makes that information easily accessible — if you have the right reporting tool and template.
If you build our social media dashboard template for yourself (instructions and screenshots included below), you’ll have a professional, client-facing dashboard that updates daily. You can customize this social media dashboard with the metrics you and your clients care about, whether that’s reach, CTR, ROAS, or anything else. And you can gather data from every platform into one place for each client.
What follows are step-by-step instructions to build a social media dashboard template in ReportGarden. For the TL;DR version, skip to any of the sections you need:
- Adding Multiple Data Sources
- Social Media Performance Overview
- Click Performance
- Social Media Reach Over Time
- Ad Performance by ROAS
- Gender and Demographic Reach
- Regional Performance
- Device Performance
- Changing the Date Range for the Entire Dashboard
- Creating a Template for Other Clients
Want to build the social media dashboard yourself? Start your 7-day ReportGarden free trial.
Adding Multiple Data Sources
In many cases, you may be running ad campaigns for the same client across multiple social media accounts and social networks (Facebook, LinkedIn, Instagram, etc.). If your dashboard only shows one data source at a time, clients aren’t getting the full picture.
With ReportGarden, you can add multiple accounts as data sources to the same dashboard and each individual widget. So all your important data lives in one dashboard.
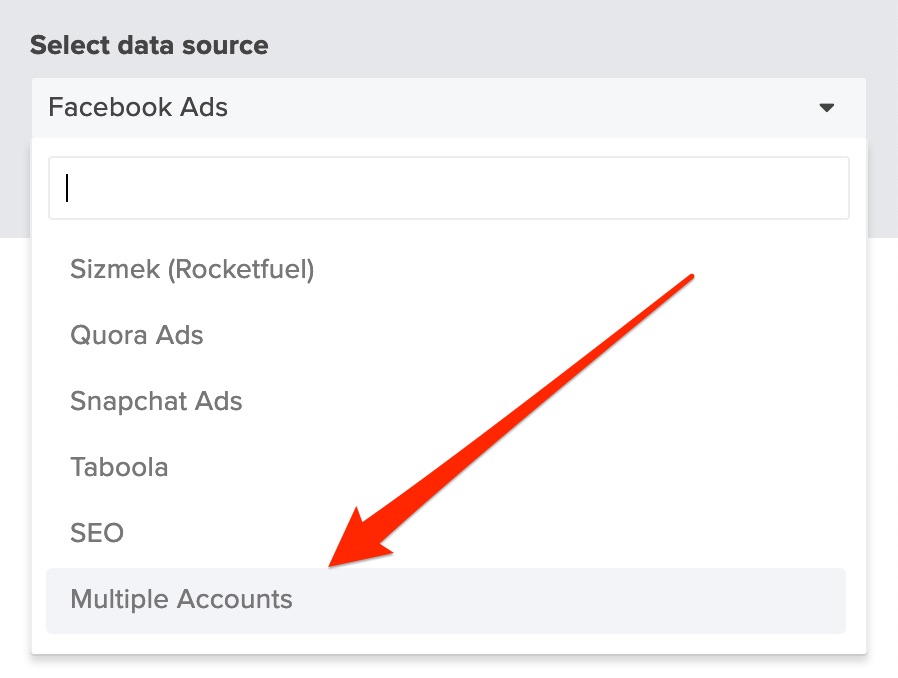
To add multiple accounts, select the widget you want to add a data source to. At the top of the settings box, click to expand the “Select data source” menu — scroll all the way to the bottom and choose “Multiple Accounts”.
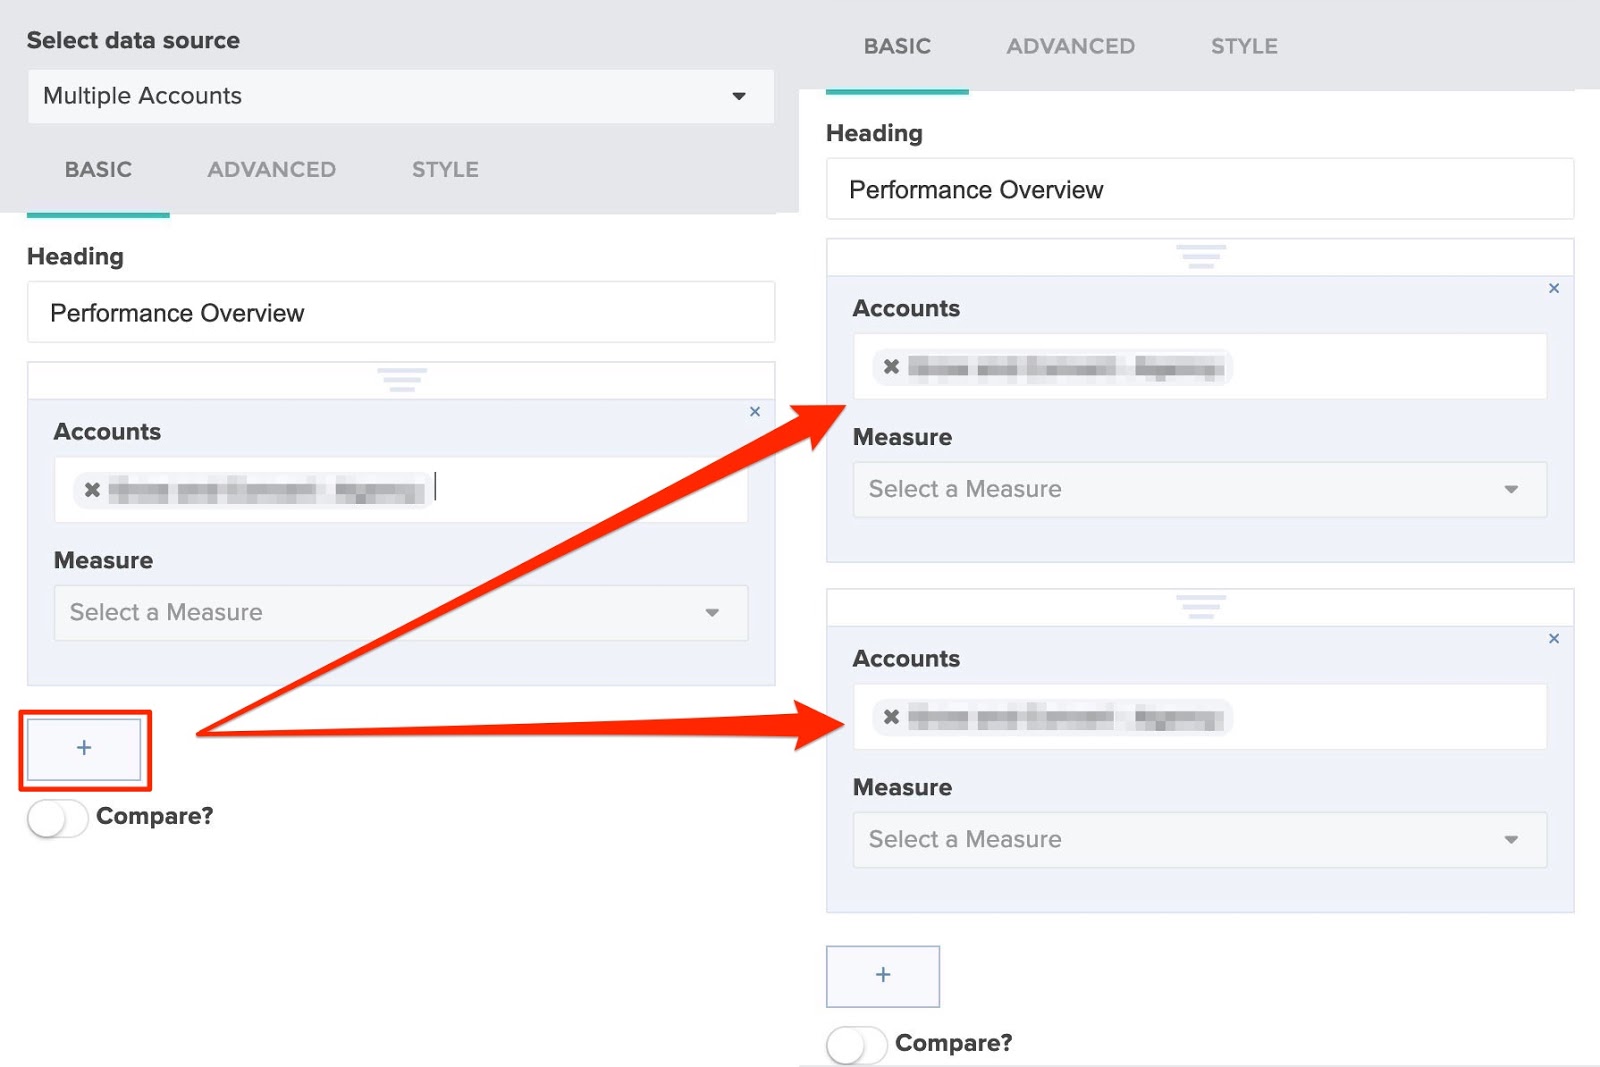
Under the initial account you added, click the plus sign button and add the second data source. Continue for as many ad accounts as you want to include.
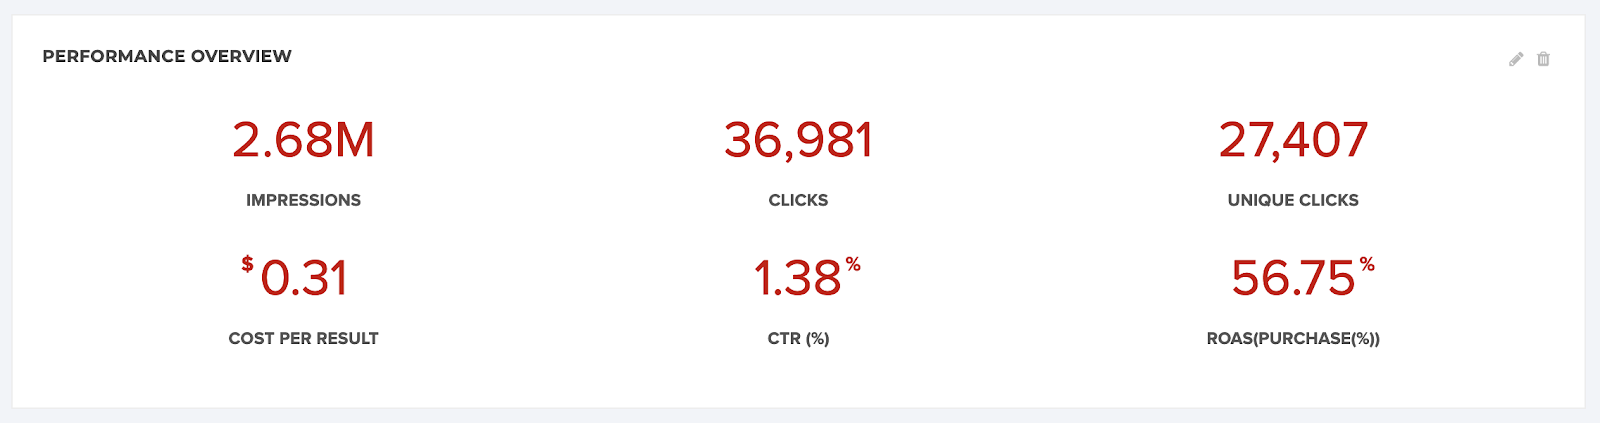
Social Media Performance Overview
The first part of the template offers a broad overview of the client’s overall social media ad performance. You can choose to include any of the KPIs that matter for you or your clients, and they’ll see a summary of the numbers they really care about.
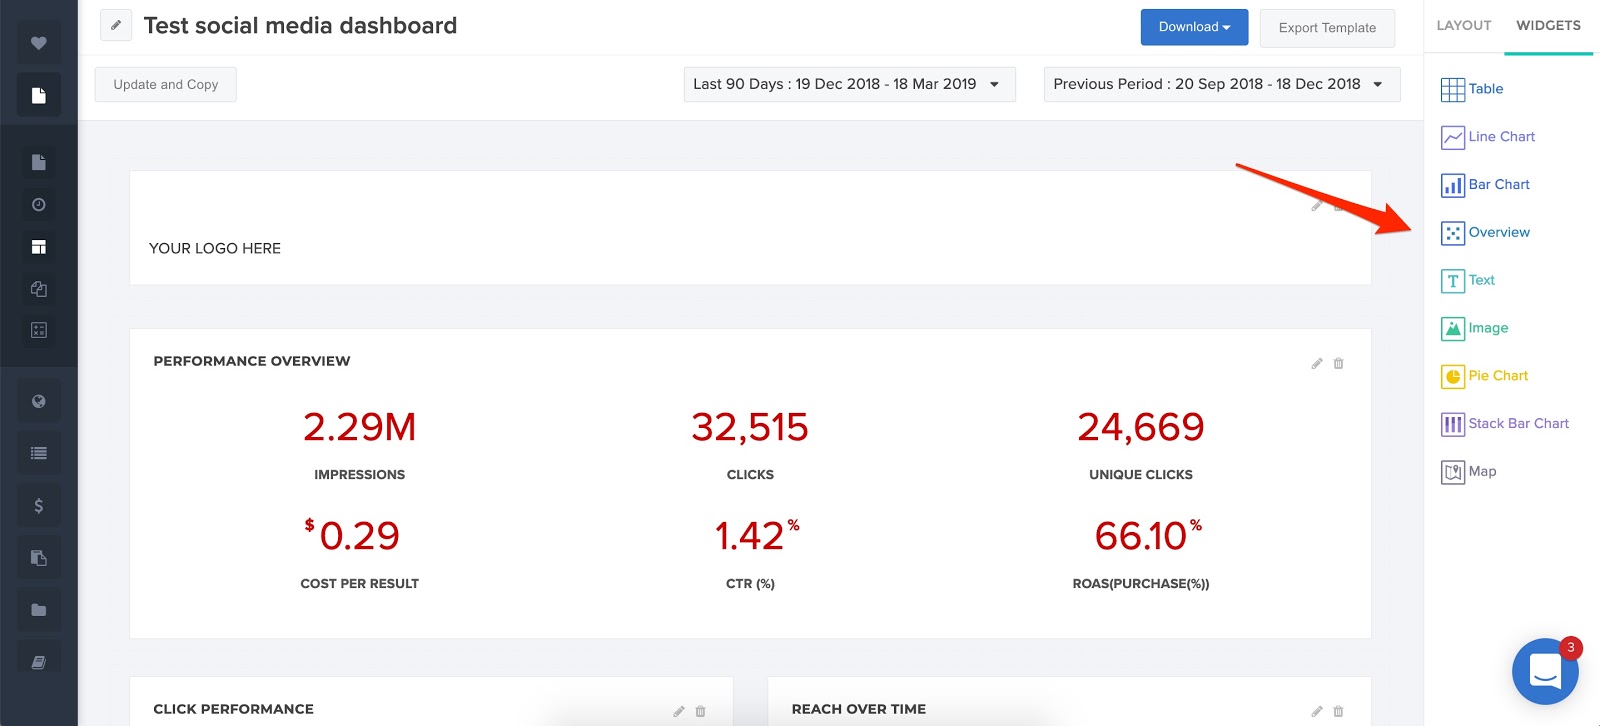
To build this section, open up a new dashboard by choosing Reporting > Dashboards in the left-hand menu. Then click the blue “New Dashboard” button in the top right.
In the right-hand toolbar, under “Widgets”, drag a new “Overview” widget to the top of the dashboard.
Settings for the widget will open in the right-hand side of the tool. Make the following selections:
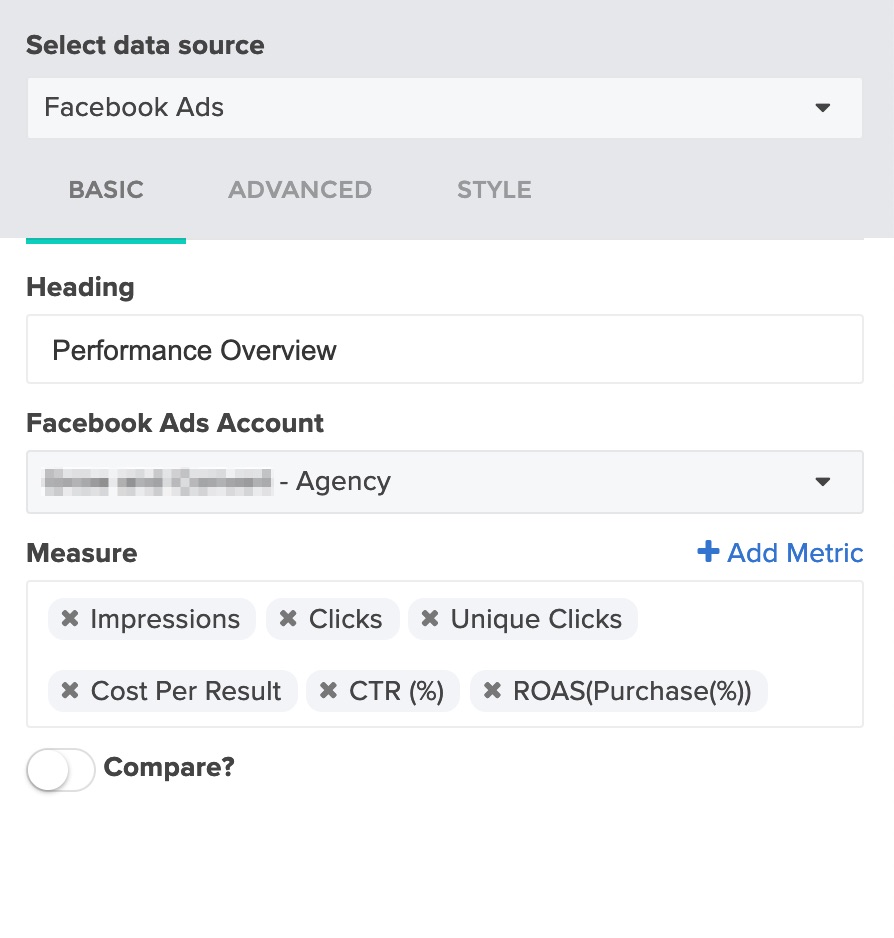
To customize this section, add or remove any of the metrics (under Measure) that you or your client want to see summarized in the overview.
You can keep the default style or select a different look under the Style tab.
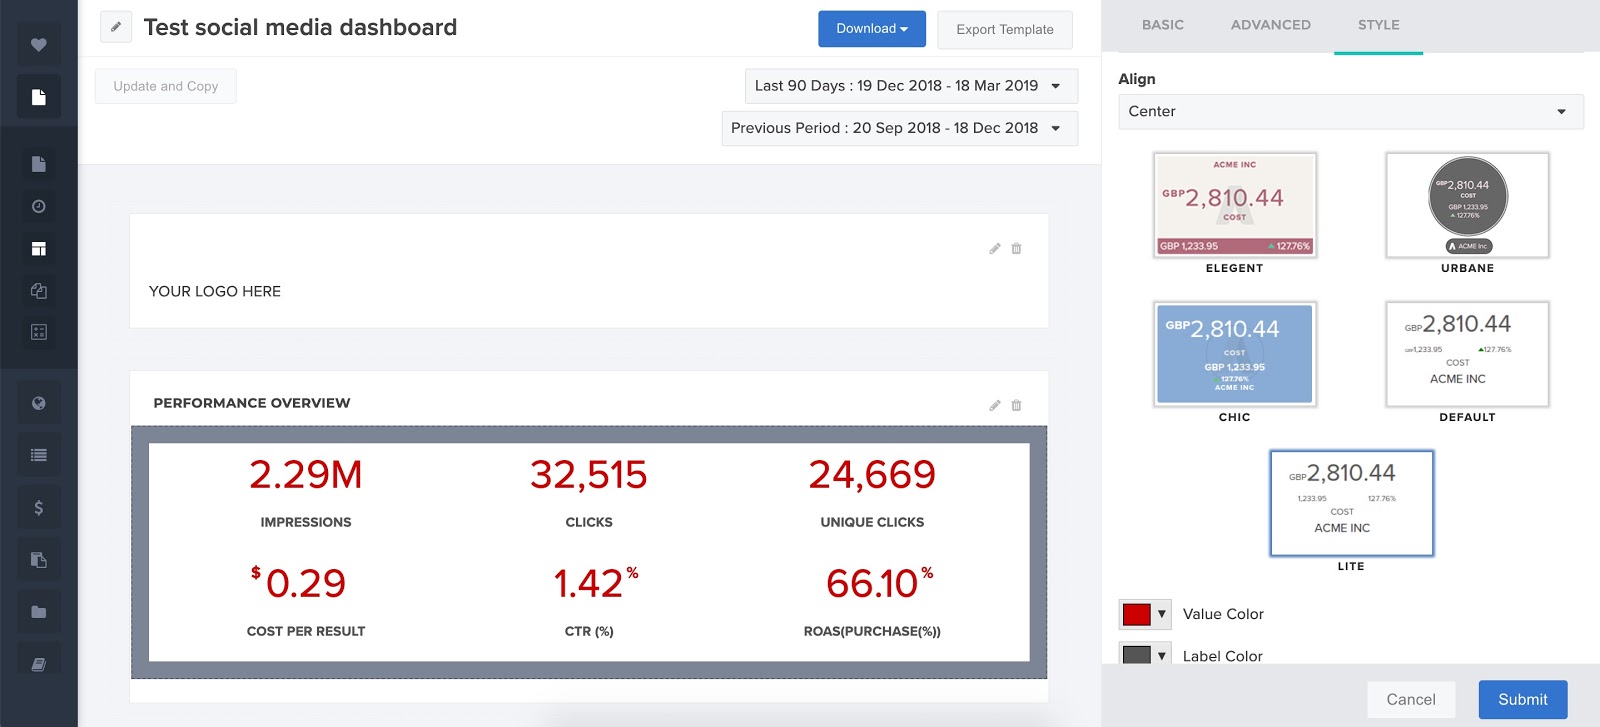
For our sample today, we used the style ‘Lite’.
For our sample today, we used the style Lite.
Click Performance
The next part of the template shows clicks and impressions over time. Here’s what the chart looks like:
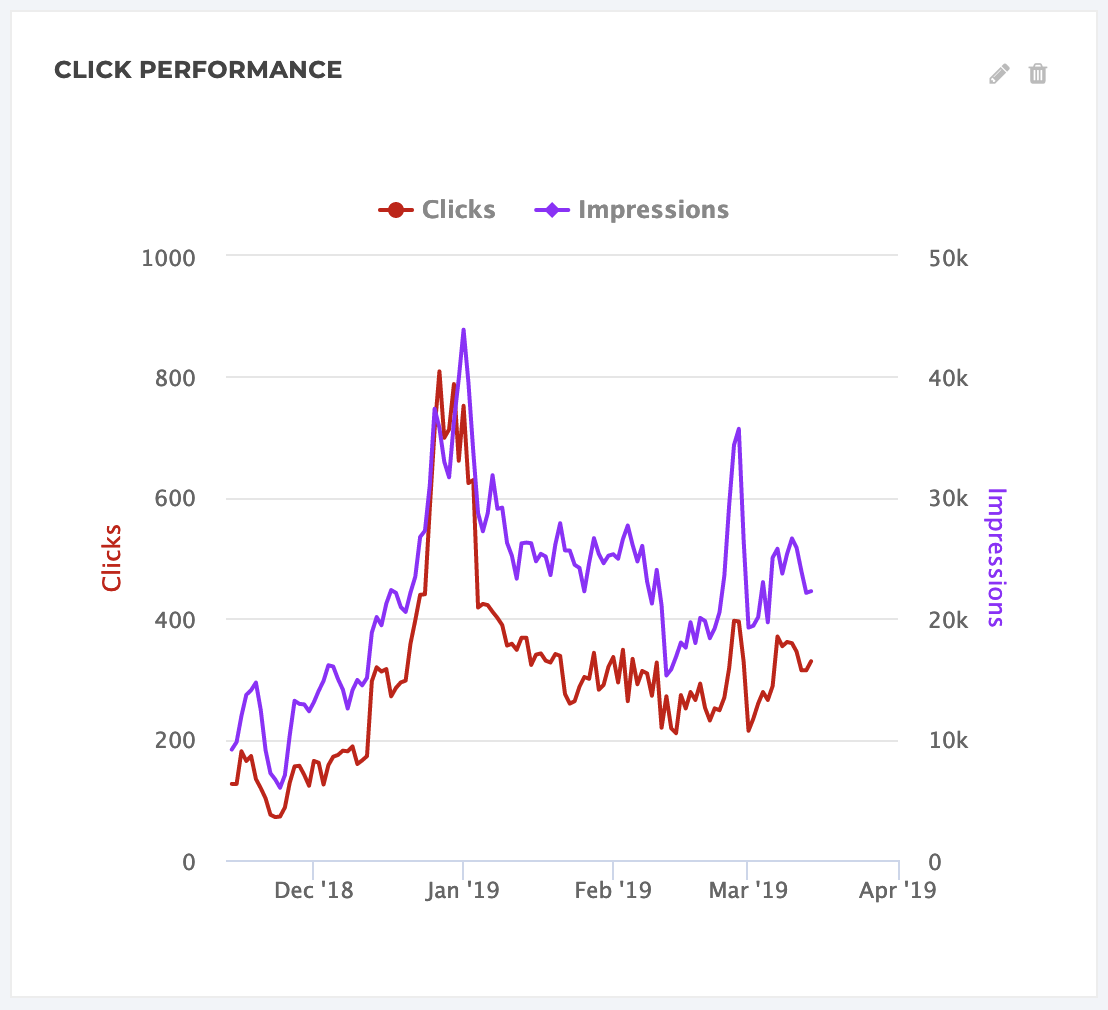
To create this section, drag-and-drop a new line graph onto the dashboard and select the following settings:
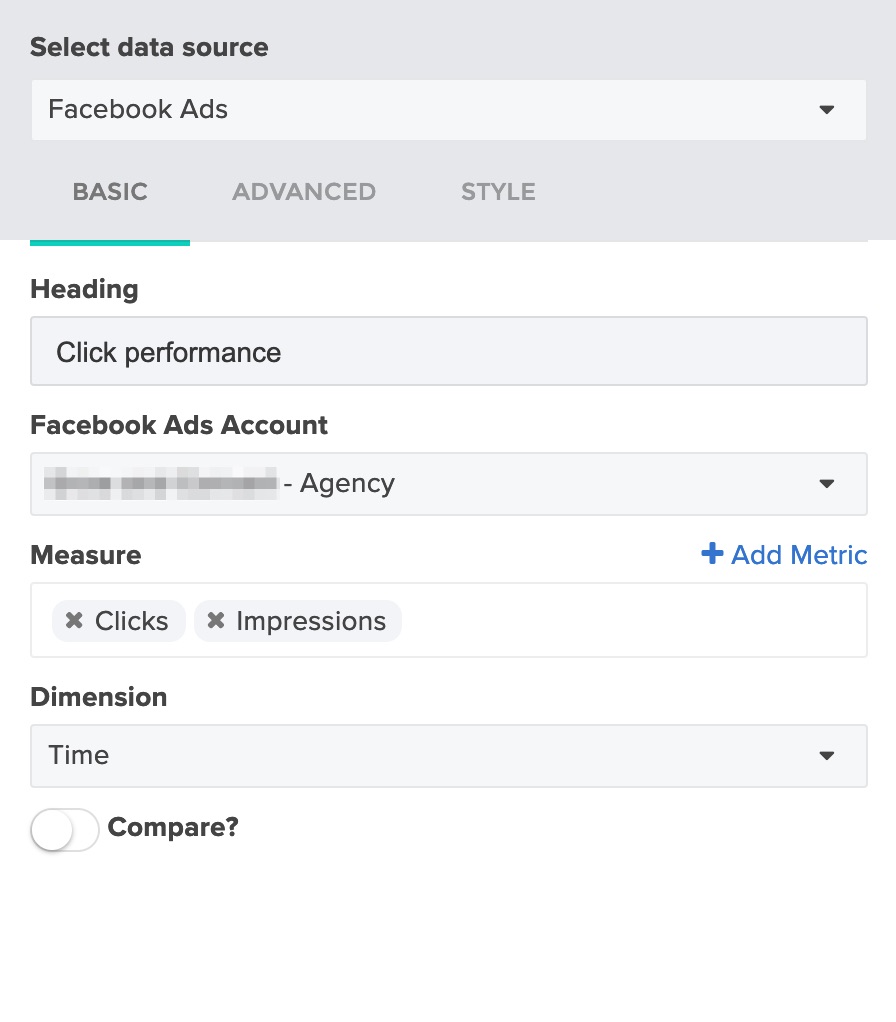
Keep in mind: our template uses Facebook Ads data, but you can select any data source you need — including multiple sources to pull in data from more than one social media platform.
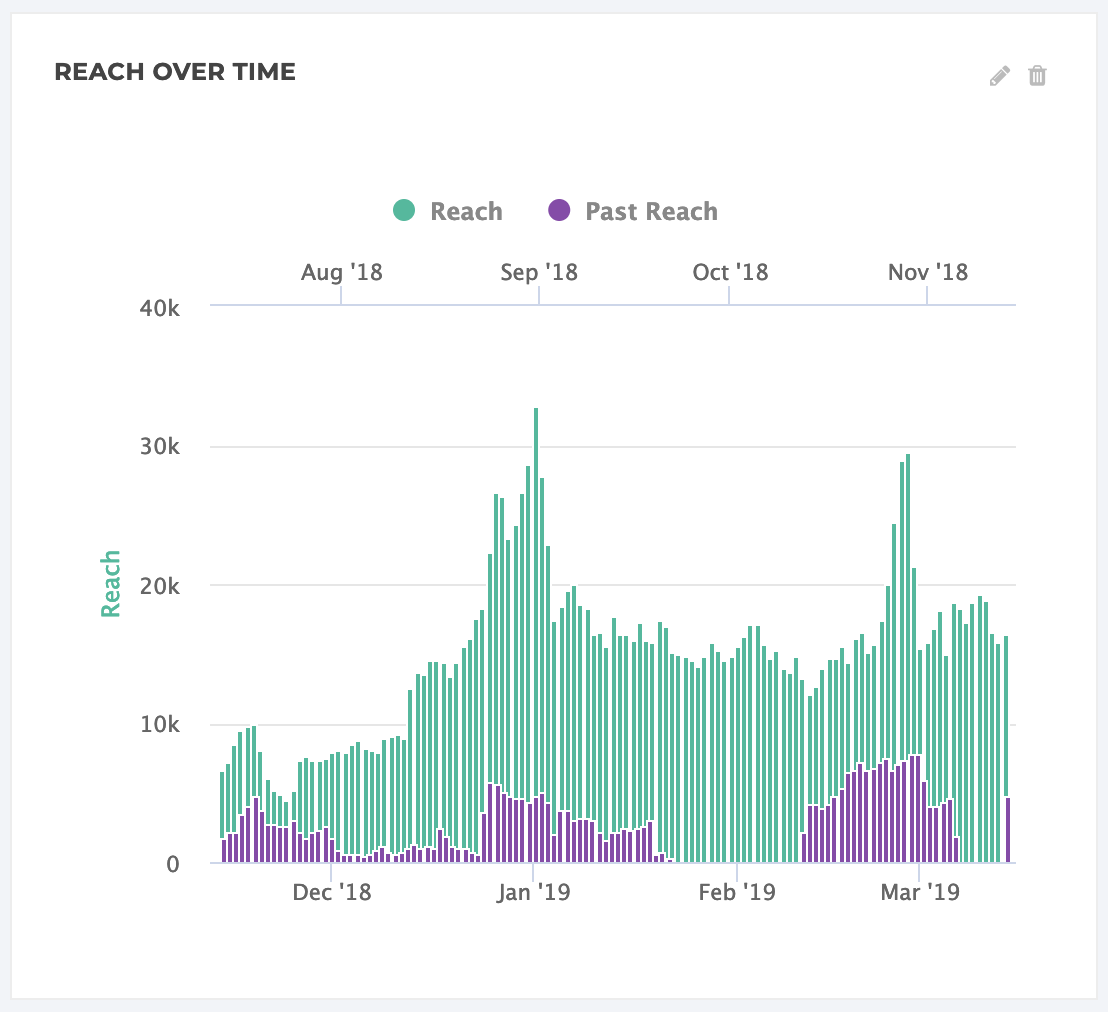
Social Media Reach Over Time
This next snapshot shows one particular metric — reach, in this case — over time. It looks like this:
To create this graph, drag a new bar graph into the dashboard and set the settings below:
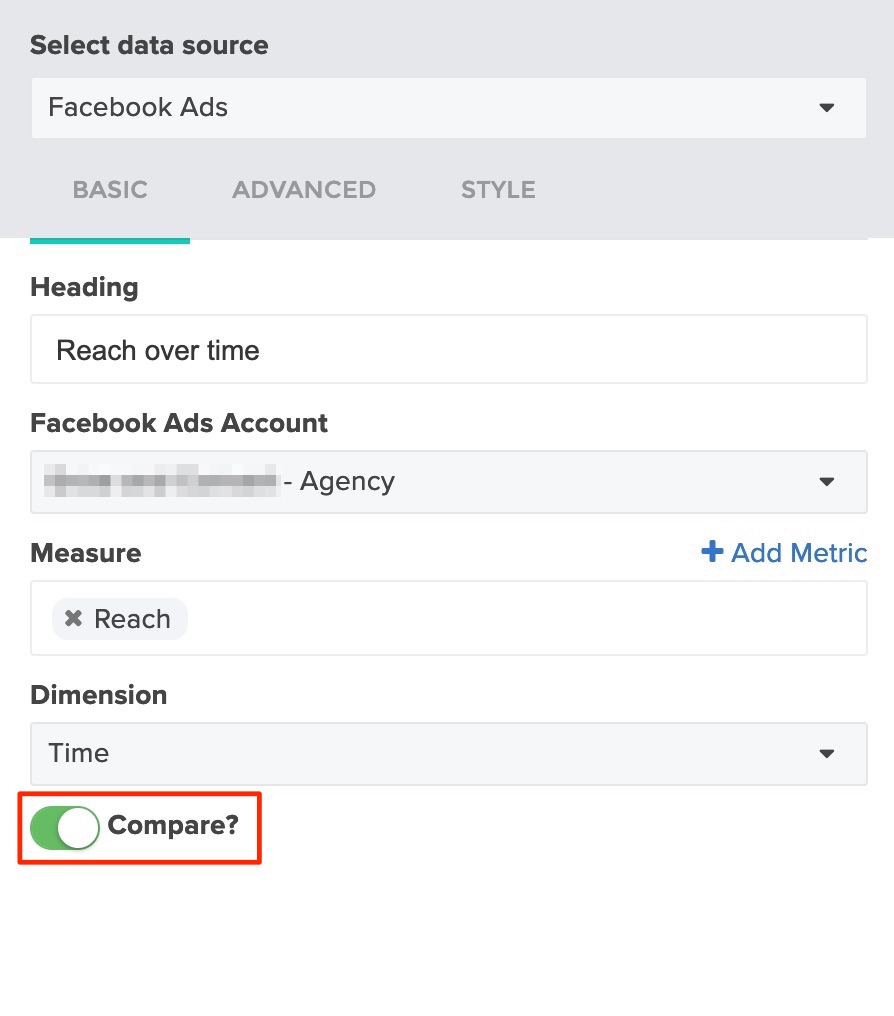
Remember to toggle “Compare” to on in order to see the current period’s performance displayed against the previous period. This will automatically update each day, as well as if you change the date settings at the top of the dashboard (more on that below).
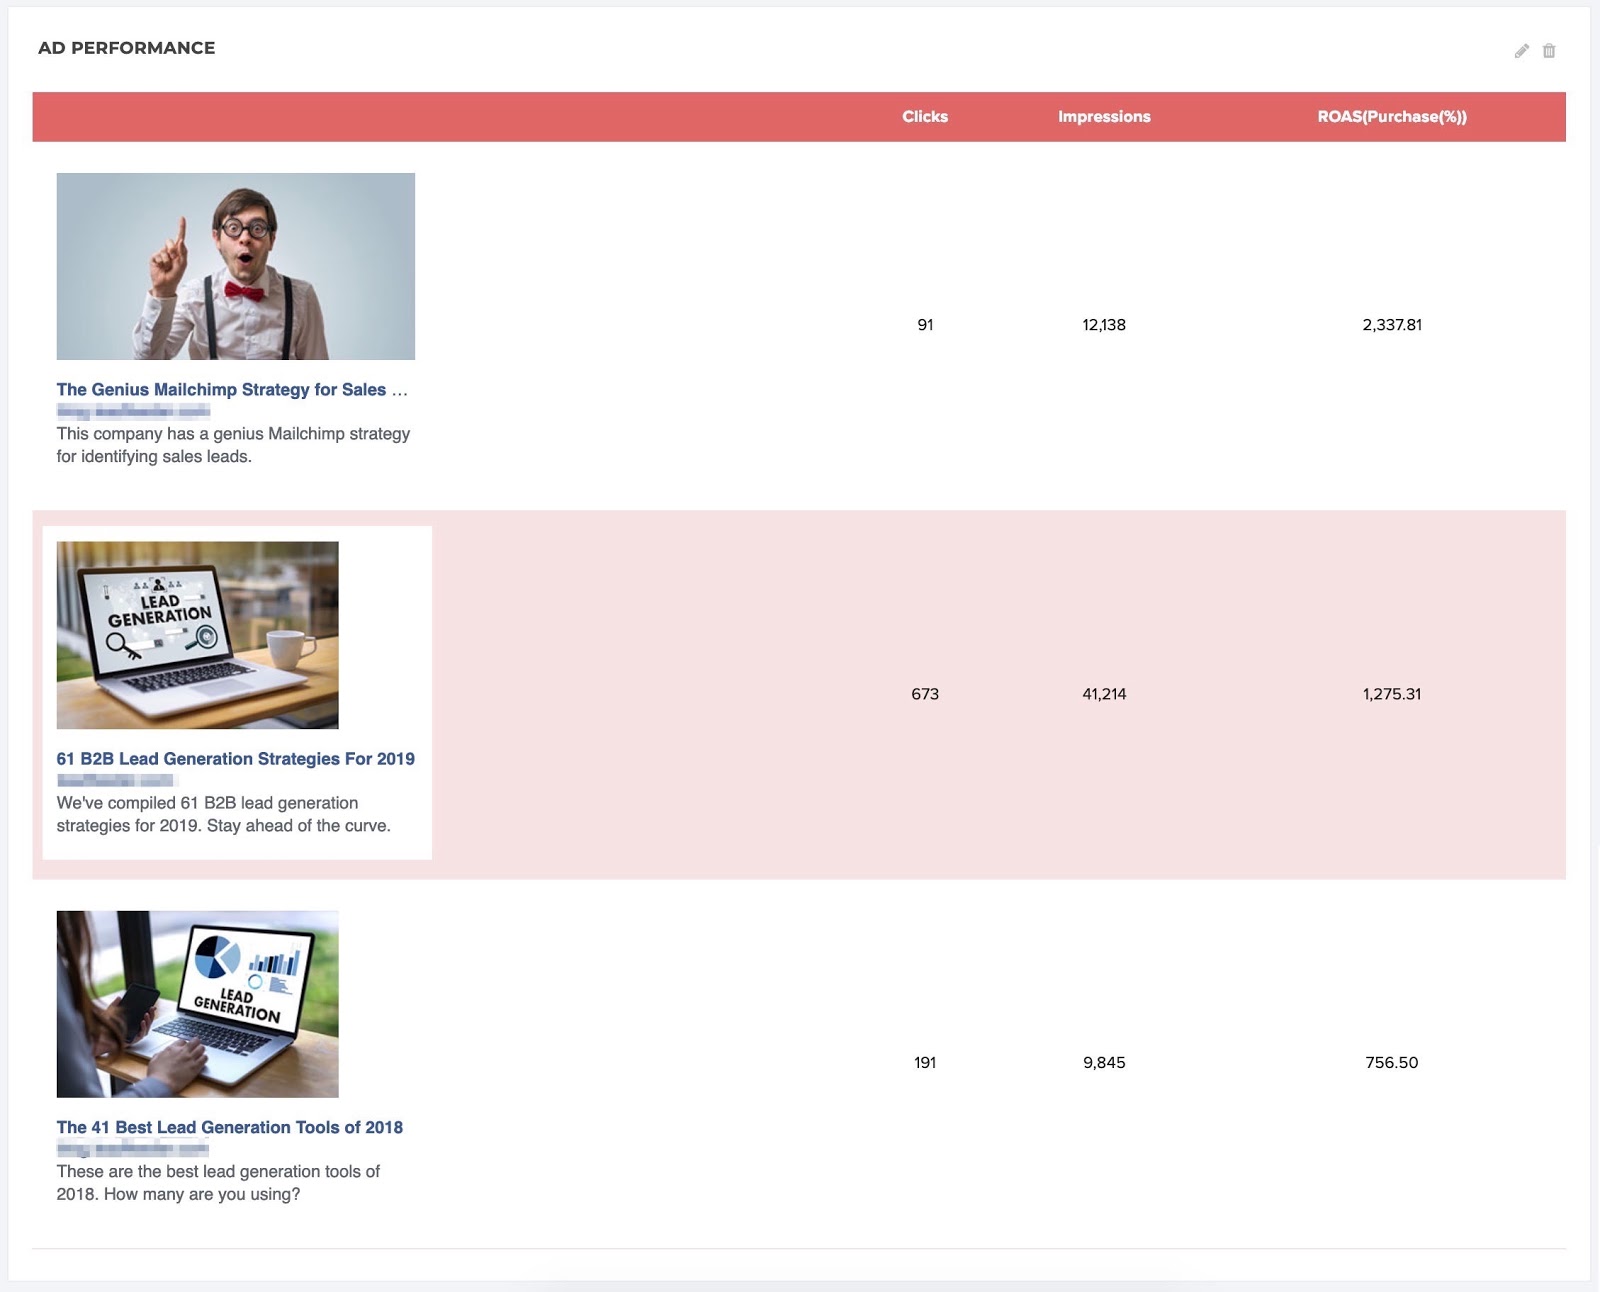
Ad Performance by ROAS
If there’s one metric clients care about most, it’s often return on ad spend (ROAS). It’s essentially their bottom line for social media advertising. In this section of the dashboard, they can see each individual ad — just as it looks on social media — along with clicks, impressions, and ROAS.
To add this table, drop a new table into the dashboard and use the following settings:
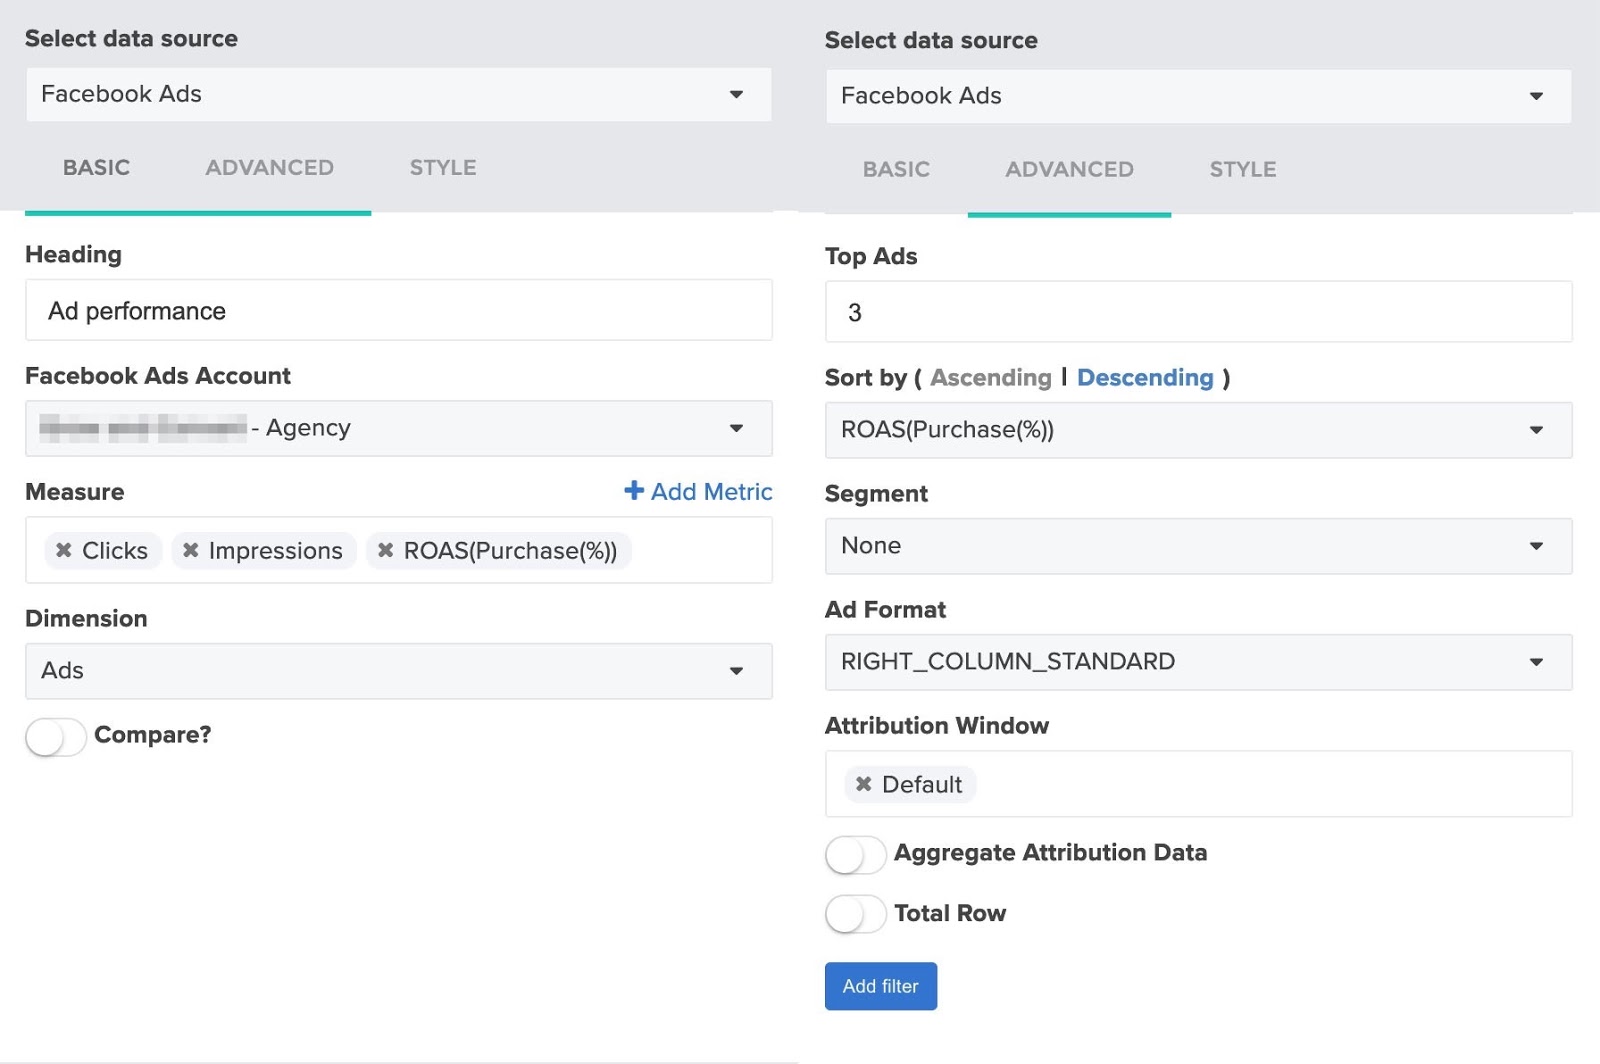
Note: You can alter the number of ads shown in the table by changing the number under “Top Ads” (in our template, it’s set to 3). You can also change the type of ad displayed to see mobile versions, desktop feed, thumbnail, and more.
Gender and Demographic Reach
This next section breaks down ad metrics by gender and demographic reach (in our example, we use age), so clients can better understand how different people react to their ad content. Here’s what that looks like:
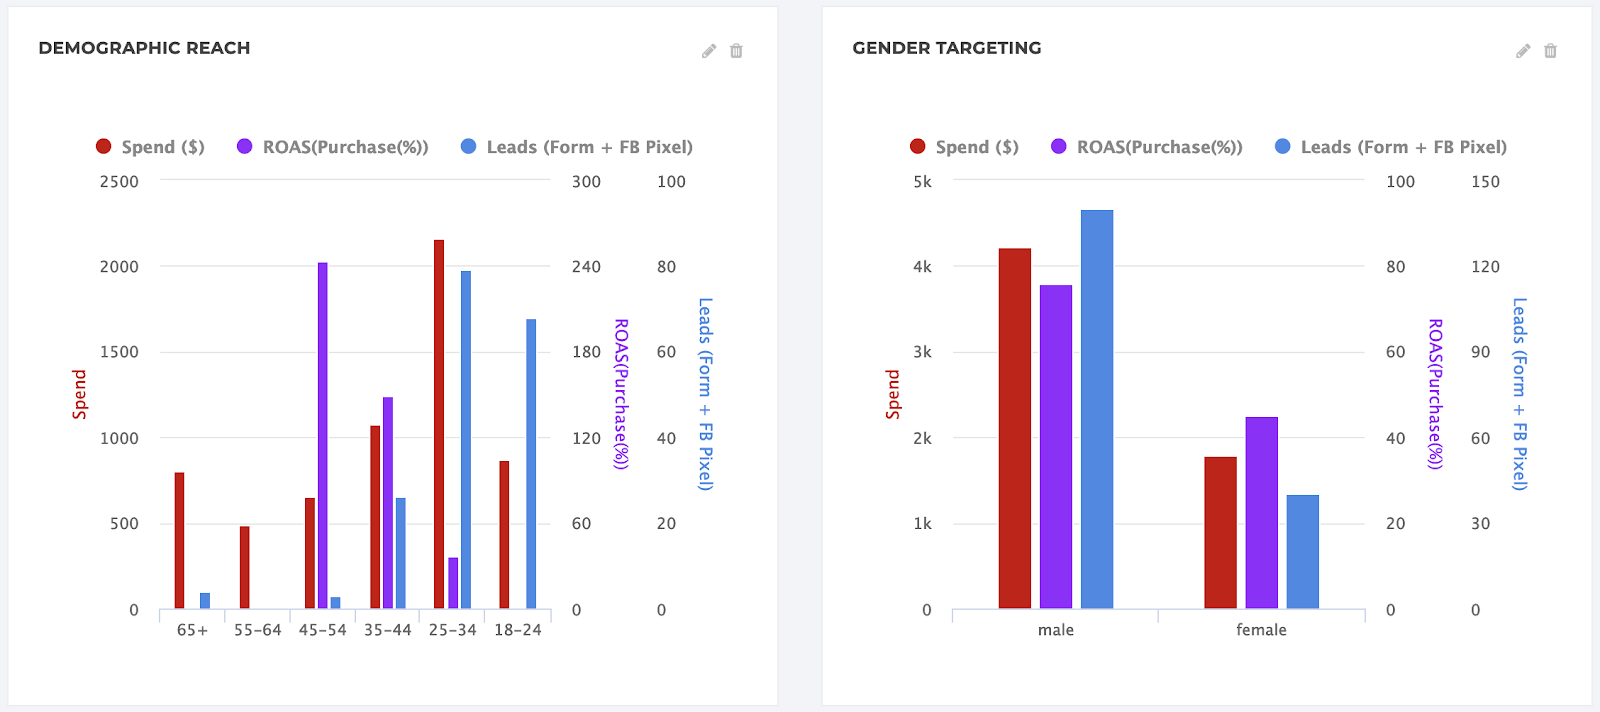
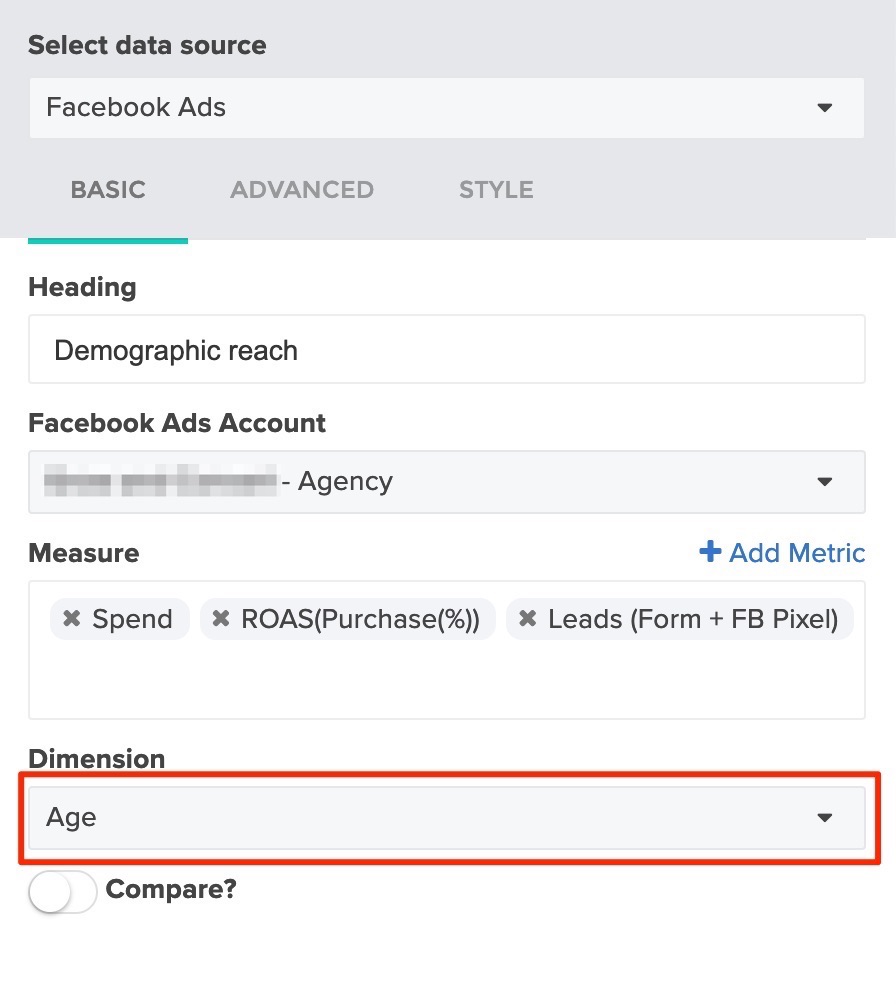
To build charts around demographic performance, use the settings below. You can switch from age to gender breakdown by changing the “Dimension” field (highlighted in red).
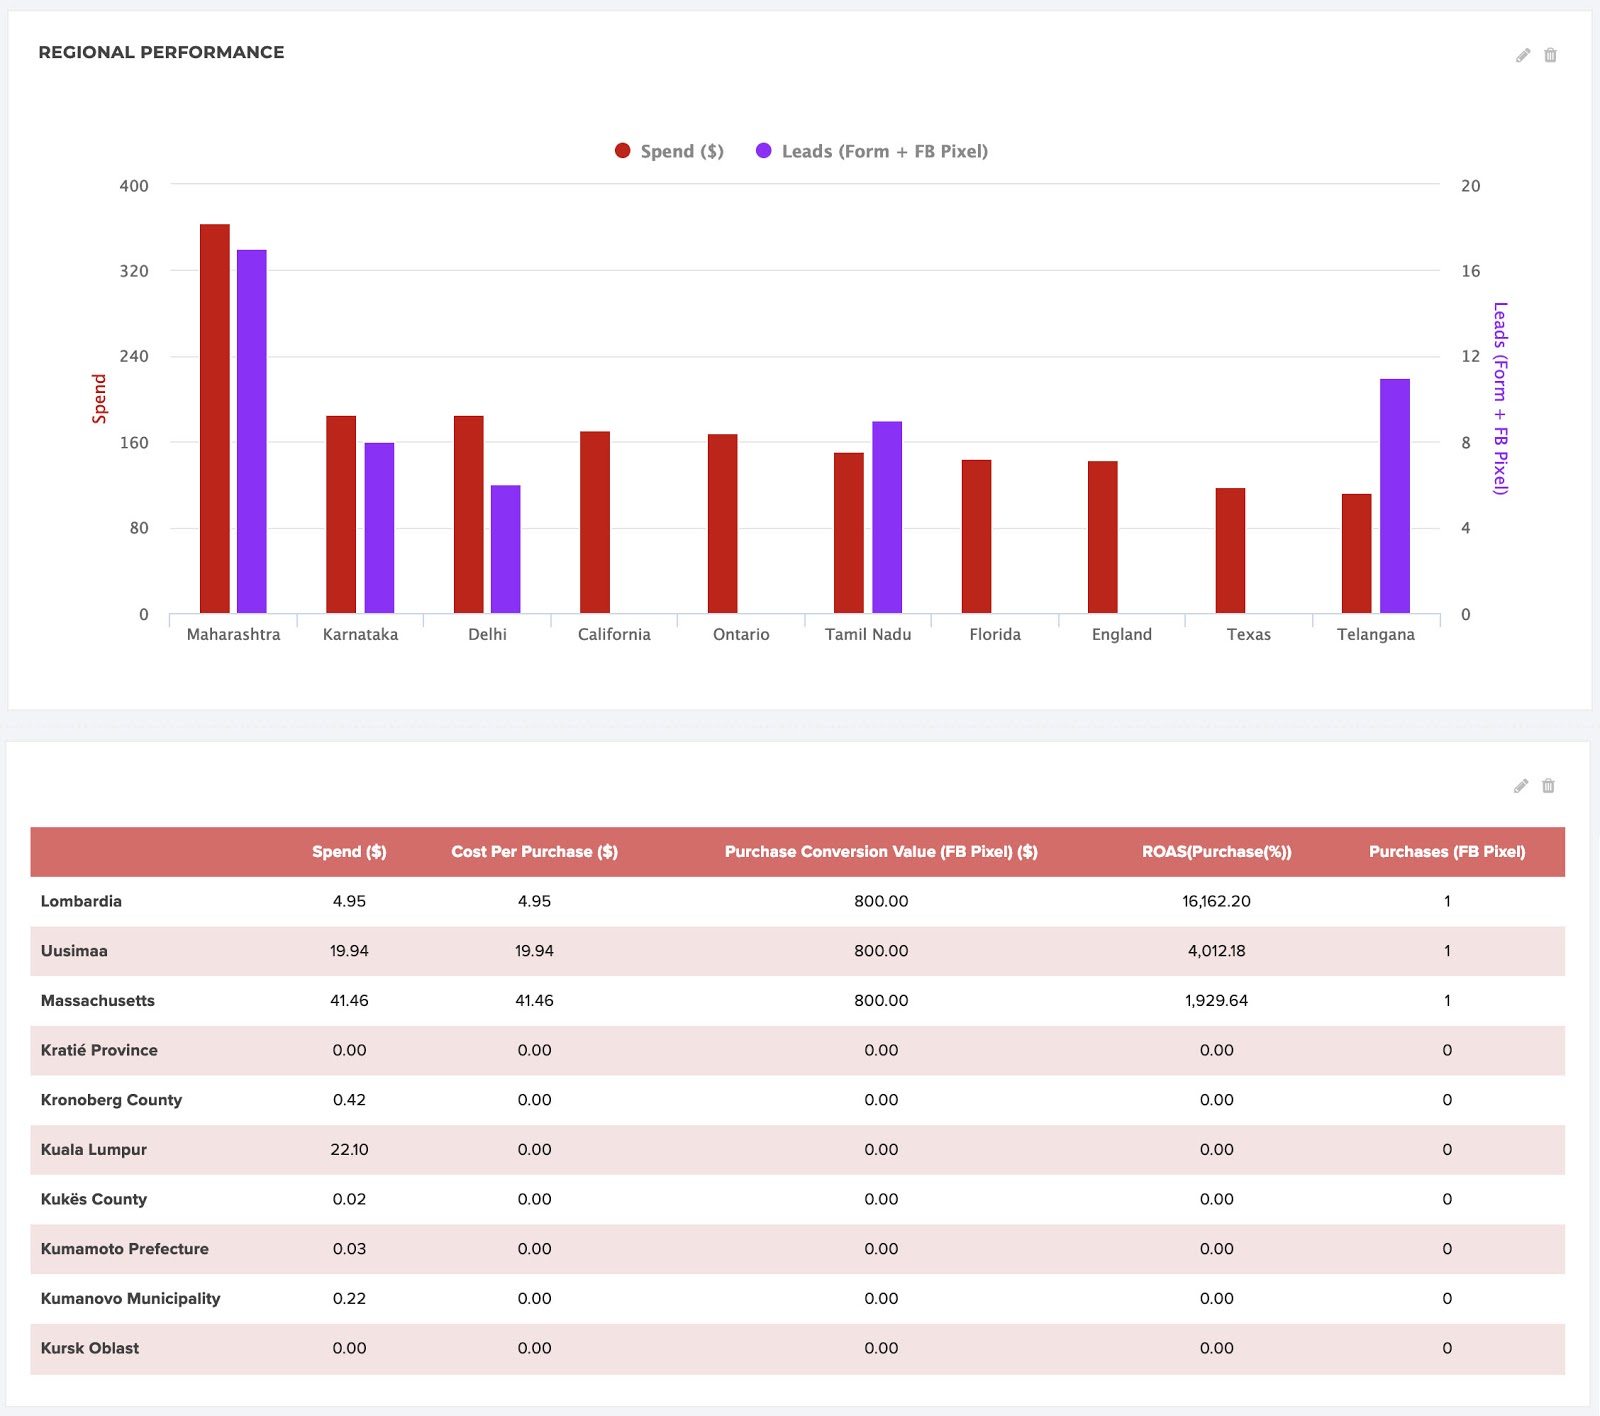
Regional Performance
The next part of the dashboard shows how ads are performing across various regions of the world. If you’re only advertising in a few close-together regions, you can view this data on a map. For our sample, ads were shown across the globe, so a chart and table made more sense. Here’s what that looks like:
We used these settings to create the chart and table:
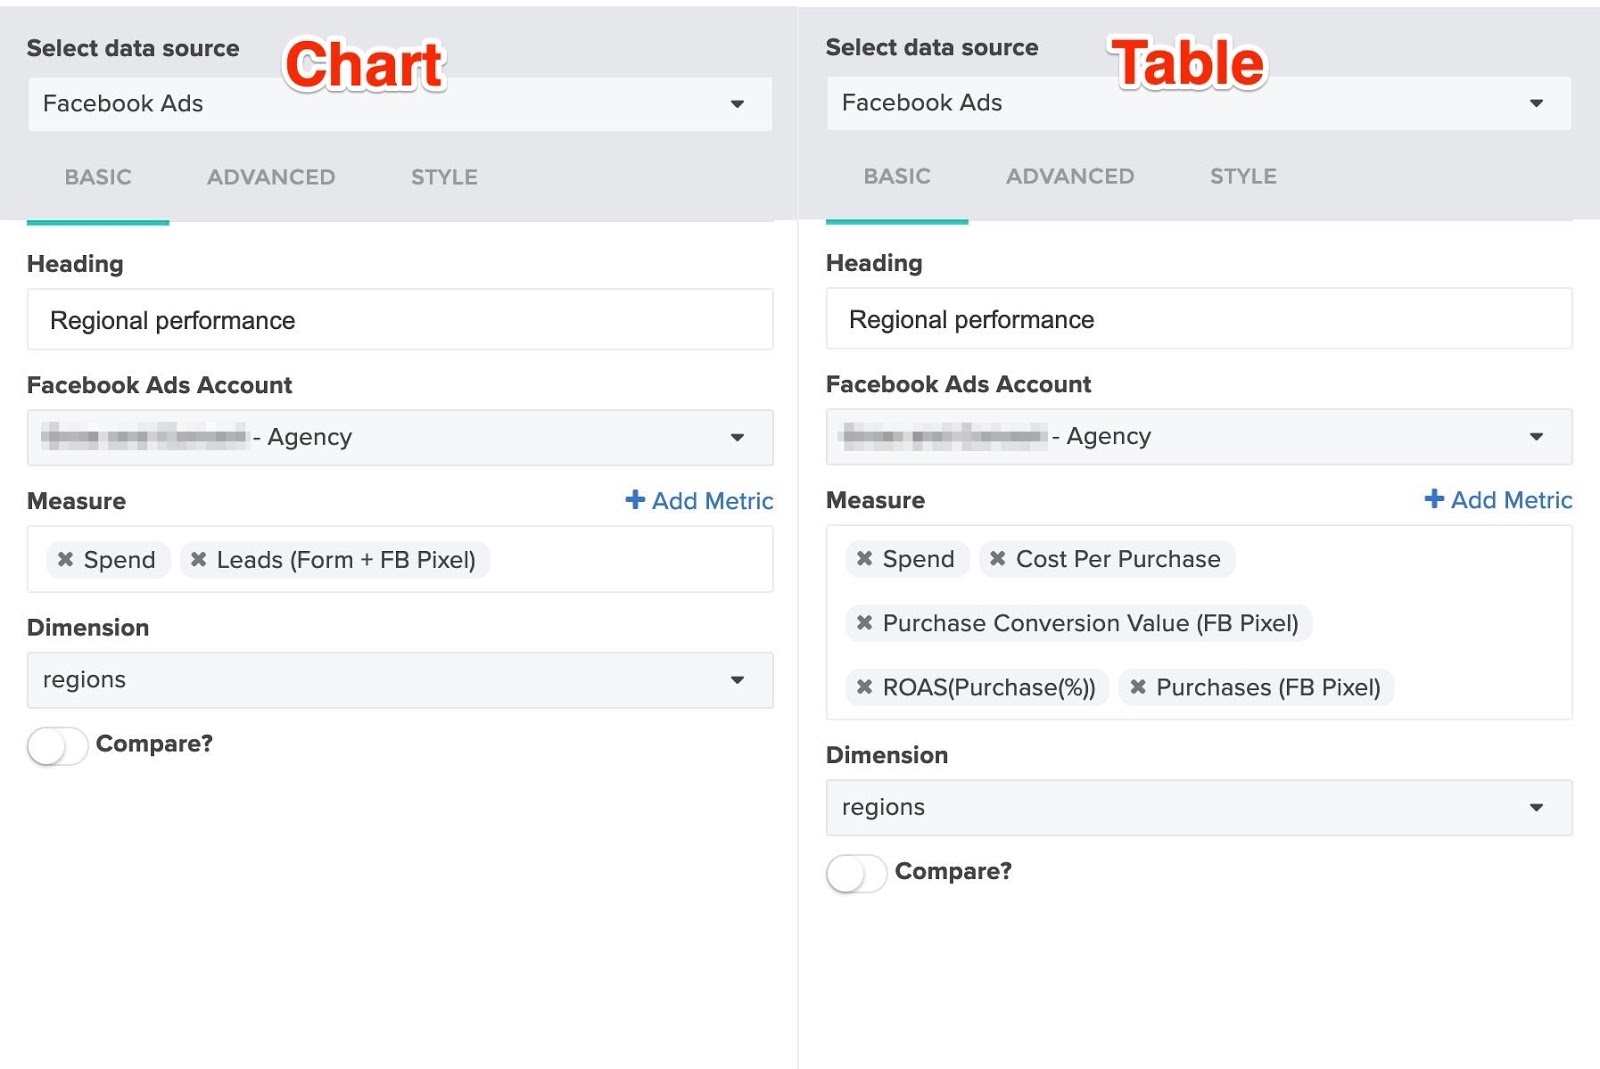
For the table, you can choose to sort by any of the included metrics. Just click over to the “Advanced” tab and change the “Sort” by value.
Device Performance
Next, our template breaks down ad performance across devices like iPhone, Android, desktop, and more. We used a chart to visualize the data, but you can also add a table like the one for regional performance — just change “Dimension” to “Placements”.
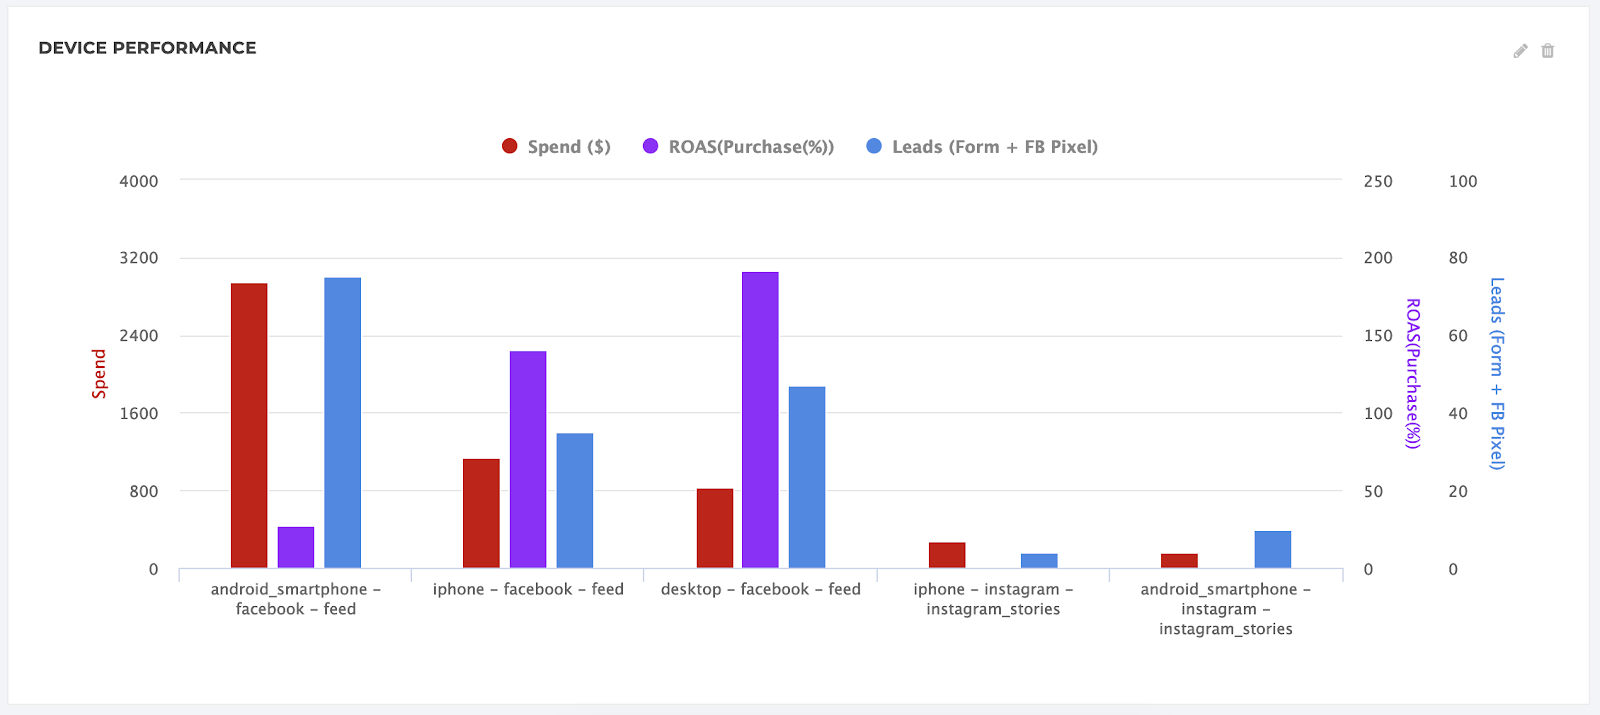
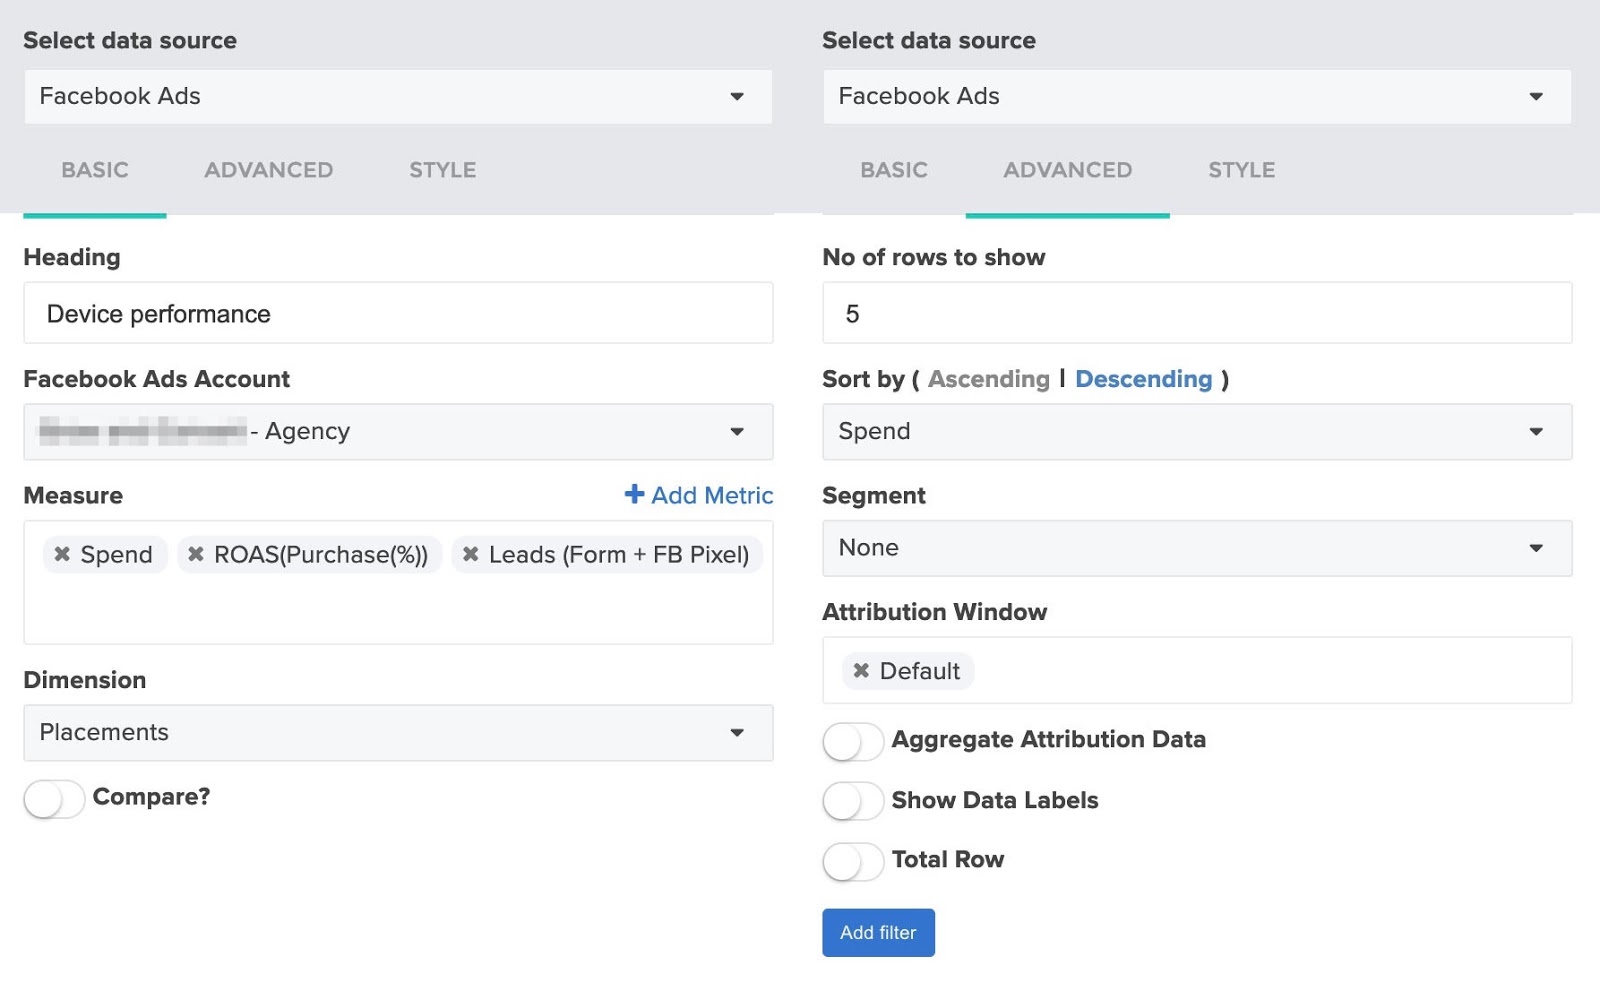
Use the settings below to get a chart like the one above. You can choose to sort by any of the metrics you use by changing the “Sort by” field in the “Advanced” tab.
Changing the Date Range for the Entire Dashboard
Your ReportGarden dashboard will automatically update data daily, and it will adjust all widgets whenever you change the set date range at the top of the dashboard. If you set the date range to, say, the last 30 days, the data will always be current for the previous 30 days, whenever a client decides to log in and check.
The secondary date range, to the right of the primary range, is what widgets will use if you toggle on “Compare” (like we did for reach over time). You can compare the current month to the prior month, last year to this year, or any two time periods you need. At the top of the dashboard, set both date ranges for “Last N Days”, and all the widgets with “Compare” enabled will update.
You can also use this feature to compare the ad performance you’ve secured for clients to their performance before they started working with you. Set the date to “Custom”, then choose the beginning date for when you began working with that client and any end date you choose.
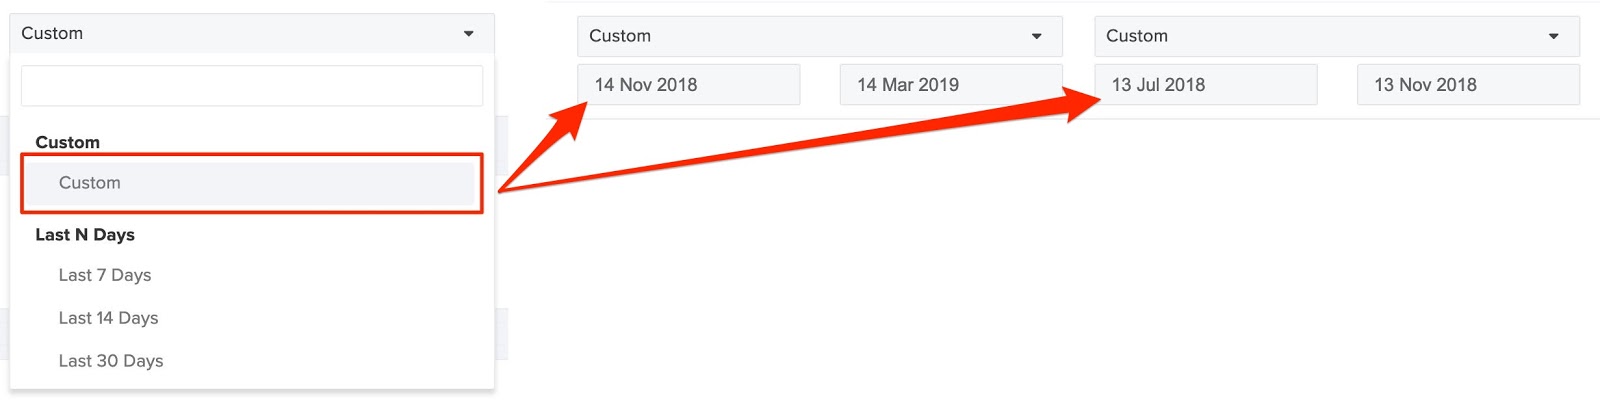
To the right, select “Custom” for the comparison date range and manually set the previous period for before you began running the client’s social media ad campaigns.
Creating a Template for Other Clients
Now that you have a top-notch social media dashboard for one client, you can turn it into a template to use for all your other clients, too.
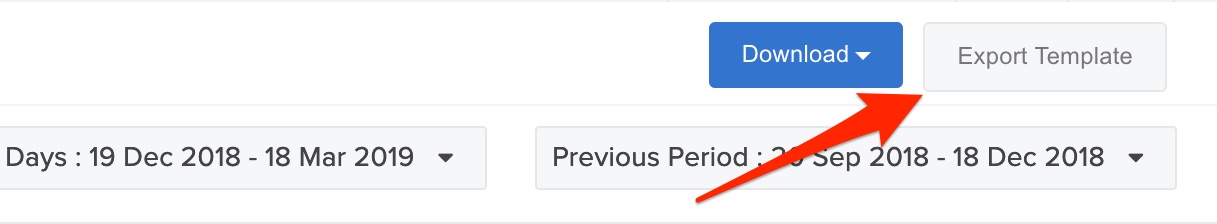
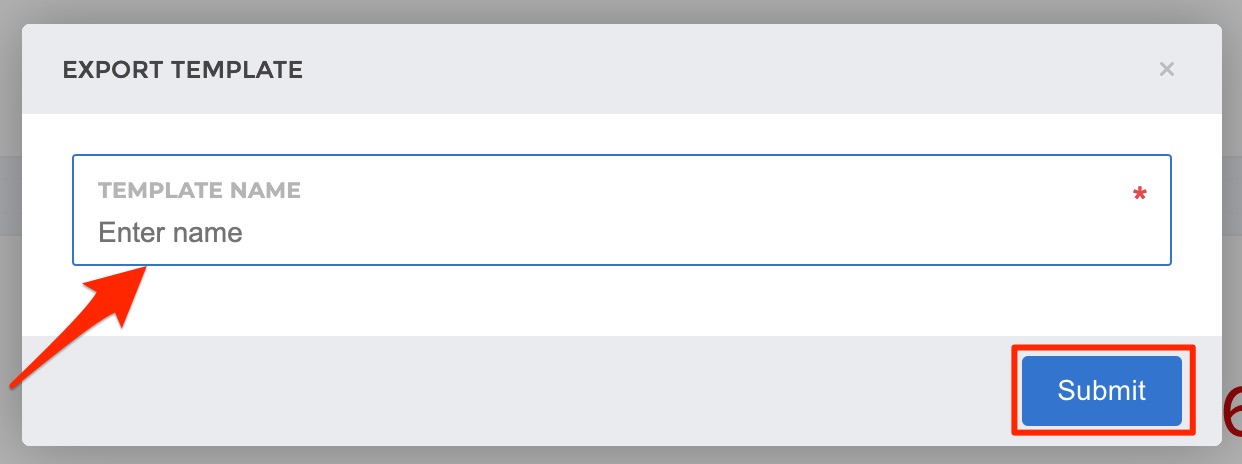
In the top right, click the gray “Export Template” button.
That opens the dialogue box below. Give the template a name (like “Client Social Media Dashboard Template”) and click Submit.
Now you have a ready-made social media dashboard.
To use it for other clients, just create a new dashboard and select the template you want to use. Choose the data source(s) for your other client’s accounts, then hit “Submit”.
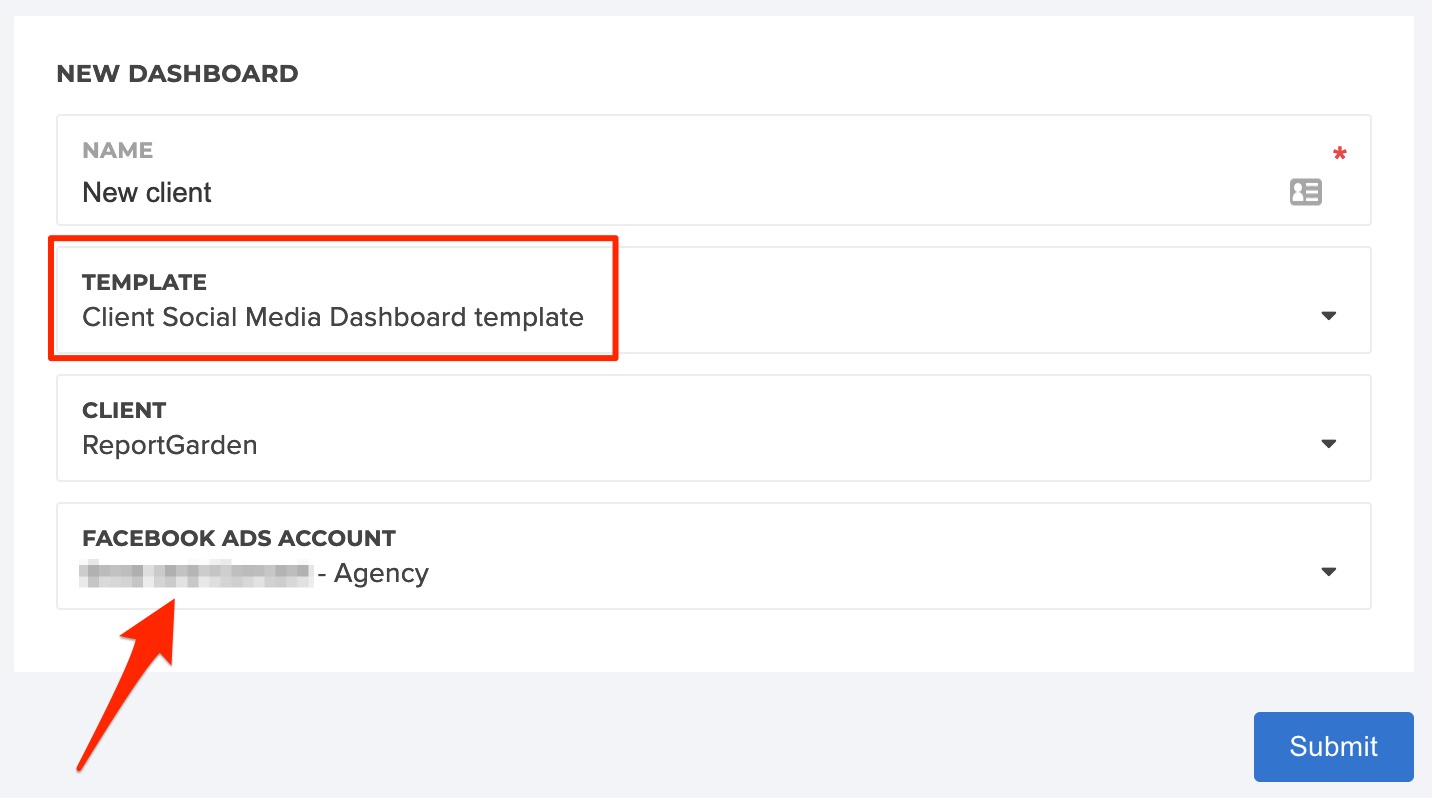
The new data will automatically populate and continue updating daily.
Wrapping Up
From pulling together data across myriad social media ad accounts to packaging it up for client consumption on a regular basis, reporting on social media management and ad performance can eat up a lot more time than it needs to.
Having an all-in-one, customizable dashboard that either of you can reference any time is just a better way to do client reporting. You save valuable time, clients are happy, and they can easily see the results you’re driving. You can read more information on social media dashboards at ReportGarden here.
Want to build the social media dashboard yourself? Start your 7-day ReportGarden free trial.
.png)


